Charter 2005 Annual Report Download - page 40
Download and view the complete annual report
Please find page 40 of the 2005 Charter annual report below. You can navigate through the pages in the report by either clicking on the pages listed below, or by using the keyword search tool below to find specific information within the annual report.-
 1
1 -
2
-
3
-
4
-
5
-
6
-
7
-
8
-
9
-
10
-
11
-
12
-
13
-
14
-
15
-
16
-
17
-
18
-
19
-
20
-
21
-
22
-
23
-
24
-
25
-
26
-
27
-
28
-
29
-
 30
30 -
 31
31 -
 32
32 -
 33
33 -
 34
34 -
 35
35 -
 36
36 -
 37
37 -
 38
38 -
 39
39 -
 40
40 -
 41
41 -
 42
42 -
 43
43 -
 44
44 -
 45
45 -
 46
46 -
 47
47 -
 48
48 -
 49
49 -
 50
50 -
51
-
52
-
53
-
54
-
55
-
56
-
57
-
58
-
59
-
60
-
61
-
62
-
63
-
64
-
65
-
66
-
67
-
68
-
69
-
70
-
71
-
72
-
73
-
74
-
75
-
76
-
77
-
78
-
79
-
80
-
81
-
82
-
83
-
84
-
85
-
86
-
87
-
88
-
89
-
90
-
91
-
92
-
93
-
94
-
95
-
96
-
97
-
98
-
99
-
100
-
101
-
102
-
103
-
104
-
105
-
106
-
107
-
108
-
109
-
110
-
111
-
112
-
113
-
114
-
115
-
116
-
117
-
118
-
119
-
120
-
121
-
122
-
123
-
124
-
125
-
126
-
127
-
128
-
129
-
130
-
131
-
132
-
133
-
134
-
135
-
136
-
137
-
138
-
139
-
140
-
141
-
142
-
143
-
144
-
145
-
146
-
147
-
148
-
149
-
150
-
151
-
152
-
153
-
154
-
155
-
156
-
157
-
158
-
159
-
160
-
161
-
162
-
163
-
164
-
165
-
166
-
167
-
168
 |
 |

CHARTER COMMUNICATIONS, INC. 2005 FORM 10-K
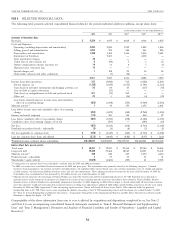
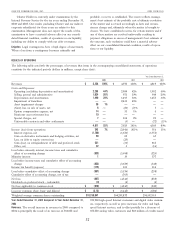
ITEM 6. SELECTED FINANCIAL DATA.
The following table presents selected consolidated financial data for the periods indicated (dollars in millions, except share data):
Charter Communications, Inc. Year Ended December 31,
2005 2004 2003(a) 2002(a) 2001(a)(b)
Statement of Operations Data:
Revenues $ 5,254 $ 4,977 $ 4,819 $ 4,566 $ 3,807
Costs and Expenses:
Operating (excluding depreciation and amortization) 2,293 2,080 1,952 1,807 1,486
Selling, general and administrative 1,034 971 940 963 826
Depreciation and amortization 1,499 1,495 1,453 1,436 2,683
Impairment of franchises —2,433 —4,638 —
Asset impairment charges 39 ————
(Gain) loss on sale of assets, net 6(86) 5 3 10
Option compensation expense (income), net 14 31 4 5 (5)
Hurricane asset retirement loss 19 ————
Special charges, net 7104 21 36 18
Unfavorable contracts and other settlements —(5) (72) ——
4,911 7,023 4,303 8,888 5,018
Income (loss) from operations 343 (2,046) 516 (4,322) (1,211)
Interest expense, net (1,789) (1,670) (1,557) (1,503) (1,310)
Gain (loss) on derivative instruments and hedging activities, net 50 69 65 (115) (50)
Loss on debt to equity conversions —(23) ———
Gain (loss) on extinguishment of debt and preferred stock 521 (31) 267 ——
Other, net 22 3 (16) (4) (59)
Loss before minority interest, income taxes and cumulative
effect of accounting change (853) (3,698) (725) (5,944) (2,630)
Minority interest(c) 119 377 3,176 1,461
Loss before income taxes and cumulative effect of accounting
change (852) (3,679) (348) (2,768) (1,169)
Income tax benefit (expense) (115) 103 110 460 12
Loss before cumulative effect of accounting change (967) (3,576) (238) (2,308) (1,157)
Cumulative effect of accounting change, net of tax —(765) —(206) (10)
Net loss (967) (4,341) (238) (2,514) (1,167)
Dividends on preferred stock – redeemable (3) (4) (4) (3) (1)
Net loss applicable to common stock $ (970) $ (4,345) $ (242) $ (2,517) $ (1,168)
Loss per common share, basic and diluted $ (3.13) $ (14.47) $ (0.82) $ (8.55) $ (4.33)
Weighted-average common shares outstanding 310,159,047 300,291,877 294,597,519 294,440,261 269,594,386
Balance Sheet Data (end of period):
Total assets $ 16,431 $ 17,673 $ 21,364 $ 22,384 $ 26,463
Long-term debt 19,388 19,464 18,647 18,671 16,343
Minority interest(c) 188 648 689 1,050 4,434
Preferred stock – redeemable 455 55 51 51
Shareholders’ equity (deficit) (4,920) (4,406) (175) 41 2,585
(a) Certain prior year amounts have been reclassified to conform with the 2005 and 2004 presentation.
(b) In 2002, we restated our consolidated financial statements for 2001 and prior years. The restatements were primarily related to the following categories: (i) launch
incentives from programmers; (ii) customer incentives and inducements; (iii) capitalized labor and overhead costs; (iv) customer acquisition costs; (v) rebuild and upgrade
of cable systems; (vi) deferred tax liabilities/franchise assets; and (vii) other adjustments. These adjustments reduced revenue for the year ended December 31, 2001 by
$146 million. Our consolidated net loss decreased by $11 million for the year ended December 31, 2001.
(c) Minority interest represents the percentage of Charter Holdco not owned by Charter, plus preferred membership interests in CC VIII. Reported losses allocated to
minority interest on the statement of operations are limited to the extent of any remaining minority interest on the balance sheet related to Charter Holdco. Because
minority interest in Charter Holdco was substantially eliminated at December 31, 2003, beginning in 2004, Charter began to absorb substantially all losses before income
taxes that otherwise would have been allocated to minority interest, resulting in an approximate additional $454 million and $2.4 billion of net losses for the years ended
December 31, 2005 and 2004, respectively. Under our existing capital structure, Charter will absorb all future losses. Paul G. Allen indirectly holds the preferred
membership units in CC VIII. There was an issue regarding the ultimate ownership of the CC VIII membership interest and this dispute was settled October 31, 2005.
See ‘‘Item 13. Certain Relationships and Related Transactions — Transactions Arising Out of Our Organizational Structure and Mr. Allen’s Investment in Charter and Its
Subsidiaries — Equity Put Rights — CC VIII.’’
Comparability of the above information from year to year is affected by acquisitions and dispositions completed by us. See Note 2
and Note 4 to our accompanying consolidated financial statements contained in ‘‘Item 8. Financial Statements and Supplementary
Data’’ and ‘‘Item 7. Management’s Discussion and Analysis of Financial Condition and Results of Operations — Liquidity and Capital
Resources.’’
30