Charter 2005 Annual Report Download - page 49
Download and view the complete annual report
Please find page 49 of the 2005 Charter annual report below. You can navigate through the pages in the report by either clicking on the pages listed below, or by using the keyword search tool below to find specific information within the annual report.-
 1
1 -
2
-
3
-
4
-
5
-
6
-
7
-
8
-
9
-
10
-
11
-
12
-
13
-
14
-
15
-
16
-
17
-
18
-
19
-
20
-
21
-
22
-
23
-
24
-
25
-
26
-
27
-
28
-
29
-
30
-
31
-
32
-
33
-
34
-
35
-
36
-
37
-
38
-
 39
39 -
 40
40 -
 41
41 -
 42
42 -
 43
43 -
 44
44 -
 45
45 -
 46
46 -
 47
47 -
 48
48 -
 49
49 -
 50
50 -
 51
51 -
 52
52 -
 53
53 -
 54
54 -
 55
55 -
 56
56 -
 57
57 -
 58
58 -
 59
59 -
60
-
61
-
62
-
63
-
64
-
65
-
66
-
67
-
68
-
69
-
70
-
71
-
72
-
73
-
74
-
75
-
76
-
77
-
78
-
79
-
80
-
81
-
82
-
83
-
84
-
85
-
86
-
87
-
88
-
89
-
90
-
91
-
92
-
93
-
94
-
95
-
96
-
97
-
98
-
99
-
100
-
101
-
102
-
103
-
104
-
105
-
106
-
107
-
108
-
109
-
110
-
111
-
112
-
113
-
114
-
115
-
116
-
117
-
118
-
119
-
120
-
121
-
122
-
123
-
124
-
125
-
126
-
127
-
128
-
129
-
130
-
131
-
132
-
133
-
134
-
135
-
136
-
137
-
138
-
139
-
140
-
141
-
142
-
143
-
144
-
145
-
146
-
147
-
148
-
149
-
150
-
151
-
152
-
153
-
154
-
155
-
156
-
157
-
158
-
159
-
160
-
161
-
162
-
163
-
164
-
165
-
166
-
167
-
168
 |
 |

CHARTER COMMUNICATIONS, INC. 2005 FORM 10-K
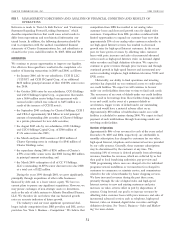
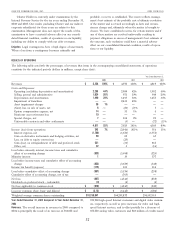
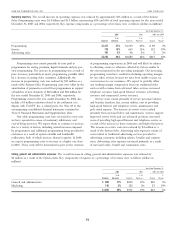
Operating expenses. The overall increase in operating expenses was reduced by approximately $15 million as a result of the System
Sales. Programming costs were $1.4 billion and $1.3 billion, representing 62% and 63% of total operating expenses for the years ended
December 31, 2005 and 2004, respectively. Key expense components as a percentage of revenues were as follows (dollars in millions):
Year Ended December 31,
2005 2004 2005 over 2004
% of % of %
Expenses Revenues Expenses Revenues Change Change
Programming $1,417 27% $1,319 27% $ 98 7%
Service 775 15% 663 13% 112 17%
Advertising sales 101 2% 98 2% 3 3%
$2,293 44% $2,080 42% $213 10%
Programming costs consist primarily of costs paid to of programming negotiations in 2006 and will likely be subject
programmers for analog, premium, digital channels and pay-per- to offsetting events or otherwise affected by factors similar to
view programming. The increase in programming was a result of the ones mentioned in the preceding paragraph. Our increasing
price increases, particularly in sports programming, partially offset programming costs have resulted in declining operating margins
by a decrease in analog video customers. Additionally, the for our video services because we have been unable to pass on
increase in programming costs was reduced by $11 million as a cost increases to our customers. We expect to partially offset
result of the Systems Sales. Programming costs were offset by the any resulting margin compression from our traditional video
amortization of payments received from programmers in support services with revenue from advanced video services, increased
of launches of new channels of $42 million and $62 million for telephone revenues, high-speed Internet revenues, advertising
the year ended December 31, 2005 and 2004, respectively. revenues and commercial service revenues.
Programming costs for the year ended December 31, 2004 also Service costs consist primarily of service personnel salaries
include a $5 million reduction related to the settlement of a and benefits, franchise fees, system utilities, cost of providing
dispute with TechTV, Inc., a related party. See Note 25 to the high-speed Internet and telephone service, maintenance and
accompanying consolidated financial statements contained in pole rental expense. The increase in service costs resulted
‘‘Item 8. Financial Statements and Supplementary Data.’’ primarily from increased labor and maintenance costs to support
Our cable programming costs have increased in every year improved service levels and our advanced products, increased
we have operated in excess of customary inflationary and costs of providing high-speed Internet and telephone service as
cost-of-living increases. We expect them to continue to increase a result of the increase in these customers and higher fuel prices.
due to a variety of factors, including annual increases imposed The increase in service costs was reduced by $4 million as a
by programmers and additional programming being provided to result of the System Sales. Advertising sales expenses consist of
customers as a result of system rebuilds and bandwidth costs related to traditional advertising services provided to
reallocation, both of which increase channel capacity. In 2006, advertising customers, including salaries, benefits and commis-
we expect programming costs to increase at a higher rate than sions. Advertising sales expenses increased primarily as a result
in 2005. These costs will be determined in part on the outcome of increased salary, benefit and commission costs.
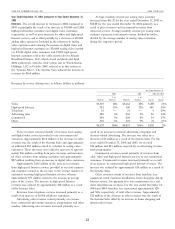
Selling, general and administrative expenses. The overall increase in selling, general and administrative expenses was reduced by
$6 million as a result of the System Sales. Key components of expense as a percentage of revenues were as follows (dollars in
millions):
Year Ended December 31,
2005 2004 2005 over 2004
% of % of %
Expenses Revenues Expenses Revenues Change Change
General and administrative $ 889 17% $849 17% $40 5%
Marketing 145 3% 122 2% 23 19%
$1,034 20% $ 971 19% $63 6%
39