Charter 2005 Annual Report Download - page 53
Download and view the complete annual report
Please find page 53 of the 2005 Charter annual report below. You can navigate through the pages in the report by either clicking on the pages listed below, or by using the keyword search tool below to find specific information within the annual report.-
 1
1 -
2
-
3
-
4
-
5
-
6
-
7
-
8
-
9
-
10
-
11
-
12
-
13
-
14
-
15
-
16
-
17
-
18
-
19
-
20
-
21
-
22
-
23
-
24
-
25
-
26
-
27
-
28
-
29
-
30
-
31
-
32
-
33
-
34
-
35
-
36
-
37
-
38
-
39
-
40
-
41
-
42
-
 43
43 -
 44
44 -
 45
45 -
 46
46 -
 47
47 -
 48
48 -
 49
49 -
 50
50 -
 51
51 -
 52
52 -
 53
53 -
 54
54 -
 55
55 -
 56
56 -
 57
57 -
 58
58 -
 59
59 -
 60
60 -
 61
61 -
 62
62 -
 63
63 -
64
-
65
-
66
-
67
-
68
-
69
-
70
-
71
-
72
-
73
-
74
-
75
-
76
-
77
-
78
-
79
-
80
-
81
-
82
-
83
-
84
-
85
-
86
-
87
-
88
-
89
-
90
-
91
-
92
-
93
-
94
-
95
-
96
-
97
-
98
-
99
-
100
-
101
-
102
-
103
-
104
-
105
-
106
-
107
-
108
-
109
-
110
-
111
-
112
-
113
-
114
-
115
-
116
-
117
-
118
-
119
-
120
-
121
-
122
-
123
-
124
-
125
-
126
-
127
-
128
-
129
-
130
-
131
-
132
-
133
-
134
-
135
-
136
-
137
-
138
-
139
-
140
-
141
-
142
-
143
-
144
-
145
-
146
-
147
-
148
-
149
-
150
-
151
-
152
-
153
-
154
-
155
-
156
-
157
-
158
-
159
-
160
-
161
-
162
-
163
-
164
-
165
-
166
-
167
-
168
 |
 |

CHARTER COMMUNICATIONS, INC. 2005 FORM 10-K
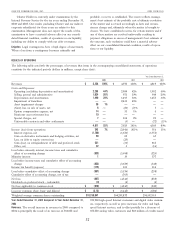
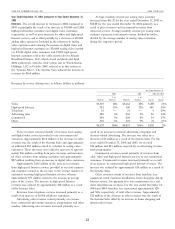
Operating expenses. The overall increase in operating expenses was reduced by approximately $59 million as a result of the System
Sales. Programming costs were $1.3 billion and $1.2 billion, representing 63% and 64% of total operating expenses for the years ended
December 31, 2004 and 2003, respectively. Key expense components as a percentage of revenues were as follows (dollars in millions):
Year Ended December 31,
2004 2003 2004 over 2003
% of % of %
Expenses Revenues Expenses Revenues Change Change
Programming $1,319 27% $1,249 26% $ 70 6%
Service 663 13% 615 12% 48 8%
Advertising sales 98 2% 88 2% 10 11%
$2,080 42% $1,952 40% $128 7%
Programming costs consist primarily of costs paid to expense as a percentage of revenues were as follows (dollars in
programmers for analog, premium and digital channels and pay- millions):
per-view programming. The increase in programming costs was
Year Ended December 31,
a result of price increases, particularly in sports programming, an
2004 2003 2004 over 2003
increased number of channels carried on our systems, and an
% of % of %
increase in digital video customers, partially offset by a decrease Expenses Revenues Expenses Revenues Change Change
in analog video customers. Additionally, the increase in pro-
General and
gramming costs was reduced by $42 million as a result of the administrative $849 17% $833 18% $16 2%
Systems Sales. Programming costs were offset by the amortiza- Marketing 122 2% 107 2% 15 14%
tion of payments received from programmers in support of $971 19% $940 20% $31 3%
launches of new channels of $62 million and $64 million for the
year ended December 31, 2004 and 2003, respectively. Program- General and administrative expenses consist primarily of
ming costs for the year ended December 31, 2004 also include a salaries and benefits, rent expense, billing costs, call center costs,
$5 million reduction related to the settlement of a dispute with internal network costs, bad debt expense and property taxes.
TechTV, Inc., a related party. See Note 25 to the accompanying The increase in general and administrative expenses resulted
consolidated financial statements contained in ‘‘Item 8. Financial primarily from increases in costs associated with our commercial
Statements and Supplementary Data.’’ business of $21 million, third party call center costs resulting
Service costs consist primarily of service personnel salaries from increased emphasis on customer service of $10 million and
and benefits, franchise fees, system utilities, Internet service bad debt expense of $10 million offset by decreases in costs
provider fees, maintenance and pole rental expense. The associated with salaries and benefits of $21 million and rent
increase in service costs resulted primarily from additional expense of $3 million.
activity associated with ongoing infrastructure maintenance. The Marketing expenses increased as a result of an increased
increase in service costs was reduced by $15 million as a result investment in marketing and branding campaigns.
of the System Sales. Advertising sales expenses consist of costs
Depreciation and amortization. Depreciation and amortization
related to traditional advertising services provided to advertising
expense increased by $42 million, or 3%. The increase in
customers, including salaries, benefits and commissions. Adver-
depreciation related to an increase in capital expenditures, which
tising sales expenses increased primarily as a result of increased
was partially offset by lower depreciation as the result of the
salary, benefit and commission costs. The increase in advertising
Systems Sales.
sales expenses was reduced by $2 million as a result of the
System Sales. Impairment of franchises. We performed an impairment assess-
ment during the third quarter of 2004. The use of lower
Selling, general and administrative expenses. The overall increase in
projected growth rates and the resulting revised estimates of
selling, general and administrative expenses was reduced by
future cash flows in our valuation, primarily as a result of
$22 million as a result of the System Sales. Key components of
increased competition, led to the recognition of a $2.4 billion
impairment charge for the year ended December 31, 2004.
(Gain) loss on sale of assets, net. Gain on sale of assets for the year
ended December 31, 2004 primarily represents the pretax gain
of $106 million realized on the sale of systems to Atlantic
Broadband Finance, LLC which closed in March and April 2004
offset by losses recognized on the disposition of plant and
equipment. Loss on sale of assets for the year ended
December 31, 2003 represents the loss recognized on the
43