Charter 2005 Annual Report Download - page 52
Download and view the complete annual report
Please find page 52 of the 2005 Charter annual report below. You can navigate through the pages in the report by either clicking on the pages listed below, or by using the keyword search tool below to find specific information within the annual report.-
 1
1 -
2
-
3
-
4
-
5
-
6
-
7
-
8
-
9
-
10
-
11
-
12
-
13
-
14
-
15
-
16
-
17
-
18
-
19
-
20
-
21
-
22
-
23
-
24
-
25
-
26
-
27
-
28
-
29
-
30
-
31
-
32
-
33
-
34
-
35
-
36
-
37
-
38
-
39
-
40
-
41
-
 42
42 -
 43
43 -
 44
44 -
 45
45 -
 46
46 -
 47
47 -
 48
48 -
 49
49 -
 50
50 -
 51
51 -
 52
52 -
 53
53 -
 54
54 -
 55
55 -
 56
56 -
 57
57 -
 58
58 -
 59
59 -
 60
60 -
 61
61 -
 62
62 -
63
-
64
-
65
-
66
-
67
-
68
-
69
-
70
-
71
-
72
-
73
-
74
-
75
-
76
-
77
-
78
-
79
-
80
-
81
-
82
-
83
-
84
-
85
-
86
-
87
-
88
-
89
-
90
-
91
-
92
-
93
-
94
-
95
-
96
-
97
-
98
-
99
-
100
-
101
-
102
-
103
-
104
-
105
-
106
-
107
-
108
-
109
-
110
-
111
-
112
-
113
-
114
-
115
-
116
-
117
-
118
-
119
-
120
-
121
-
122
-
123
-
124
-
125
-
126
-
127
-
128
-
129
-
130
-
131
-
132
-
133
-
134
-
135
-
136
-
137
-
138
-
139
-
140
-
141
-
142
-
143
-
144
-
145
-
146
-
147
-
148
-
149
-
150
-
151
-
152
-
153
-
154
-
155
-
156
-
157
-
158
-
159
-
160
-
161
-
162
-
163
-
164
-
165
-
166
-
167
-
168
 |
 |

CHARTER COMMUNICATIONS, INC. 2005 FORM 10-K
Year Ended December 31, 2004 Compared to Year Ended December 31, Average monthly revenue per analog video customer
2003 increased from $61.92 for the year ended December 31, 2003 to
Revenues. The overall increase in revenues in 2004 compared to $68.02 for the year ended December 31, 2004 primarily as a
2003 is principally the result of an increase of 318,800 and 2,800 result of price increases and incremental revenues from
high-speed Internet customers and digital video customers, advanced services. Average monthly revenue per analog video
respectively, as well as price increases for video and high-speed customer represents total annual revenue, divided by twelve,
Internet services, and is offset partially by a decrease of 439,800 divided by the average number of analog video customers
analog video customers. Included in the reduction in analog during the respective period.
video customers and reducing the increase in digital video and
high-speed Internet customers are 230,800 analog video custom-
ers, 83,300 digital video customers and 37,800 high-speed
Internet customers sold in the cable system sales to Atlantic
Broadband Finance, LLC, which closed in March and April
2004 (collectively, with the cable system sale to WaveDivision
Holdings, LLC in October 2003, referred to in this section as
the ‘‘Systems Sales’’). The Systems Sales reduced the increase in
revenues by $160 million.
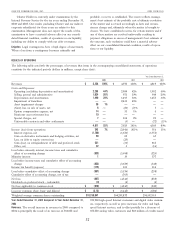
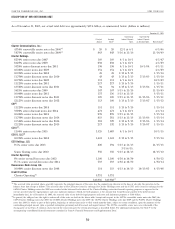
Revenues by service offering were as follows (dollars in millions):
Year Ended December 31,
2004 2003 2004 over 2003
% of % of %
Revenues Revenues Revenues Revenues Change Change
Video $3,373 68% $3,461 72% $ (88) (3)%
High-speed Internet 741 15% 556 12% 185 33%
Telephone 18 —14 —4 29%
Advertising sales 289 6% 263 5% 26 10%
Commercial 238 5% 204 4% 34 17%
Other 318 6% 321 7% (3) (1)%
$4,977 100% $4,819 100% $158 3%
Video revenues consist primarily of revenues from analog result of an increase in national advertising campaigns and
and digital video services provided to our non-commercial election related advertising. The increase was offset by a
customers. Approximately $116 million of the decrease in video decrease of $7 million as a result of the System Sales. For the
revenues was the result of the Systems Sales and approximately years ended December 31, 2004 and 2003, we received
an additional $65 million related to a decline in analog video $16 million and $15 million, respectively, in advertising revenue
customers. These decreases were offset by increases of approxi- from programmers.
mately $66 million resulting from price increases and incremen- Commercial revenues consist primarily of revenues from
tal video revenues from existing customers and approximately cable video and high-speed Internet services to our commercial
$27 million resulting from an increase in digital video customers. customers. Commercial revenues increased primarily as a result
Approximately $163 million of the increase in revenues of an increase in commercial high-speed Internet revenues. The
from high-speed Internet services provided to our non-commer- increase was reduced by approximately $14 million as a result of
cial customers related to the increase in the average number of the Systems Sales.
customers receiving high-speed Internet services, whereas Other revenues consist of revenues from franchise fees,
approximately $35 million related to the increase in average equipment rental, customer installations, home shopping, dial-up
price of the service. The increase in high-speed Internet Internet service, late payment fees, wire maintenance fees and
revenues was reduced by approximately $12 million as a result other miscellaneous revenues. For the year ended December 31,
of the Systems Sales. 2004 and 2003, franchise fees represented approximately 52%
Revenues from telephone services increased primarily as a and 50%, respectively, of total other revenues. Approximately
result of an increase of 20,500 telephone customers. $11 million of the decrease in other revenues was the result of
Advertising sales revenues consist primarily of revenues the Systems Sales offset by an increase in home shopping and
from commercial advertising customers, programmers and other infomercial revenue.
vendors. Advertising sales revenues increased primarily as a
42