Dell 2010 Annual Report Download - page 36
Download and view the complete annual report
Please find page 36 of the 2010 Dell annual report below. You can navigate through the pages in the report by either clicking on the pages listed below, or by using the keyword search tool below to find specific information within the annual report.-
 1
1 -
2
-
3
-
4
-
5
-
6
-
7
-
8
-
9
-
10
-
11
-
12
-
13
-
14
-
15
-
16
-
17
-
18
-
19
-
20
-
21
-
22
-
23
-
24
-
25
-
 26
26 -
 27
27 -
 28
28 -
 29
29 -
 30
30 -
 31
31 -
 32
32 -
 33
33 -
 34
34 -
 35
35 -
 36
36 -
 37
37 -
 38
38 -
 39
39 -
 40
40 -
 41
41 -
 42
42 -
 43
43 -
 44
44 -
 45
45 -
 46
46 -
47
-
48
-
49
-
50
-
51
-
52
-
53
-
54
-
55
-
56
-
57
-
58
-
59
-
60
-
61
-
62
-
63
-
64
-
65
-
66
-
67
-
68
-
69
-
70
-
71
-
72
-
73
-
74
-
75
-
76
-
77
-
78
-
79
-
80
-
81
-
82
-
83
-
84
-
85
-
86
-
87
-
88
-
89
-
90
-
91
-
92
-
93
-
94
-
95
-
96
-
97
-
98
-
99
-
100
-
101
-
102
-
103
-
104
-
105
-
106
-
107
-
108
-
109
-
110
-
111
-
112
-
113
-
114
-
115
-
116
-
117
-
118
-
119
-
120
-
121
-
122
-
123
-
124
-
125
-
126
-
127
-
128
-
129
-
130
-
131
-
132
-
133
-
134
-
135
-
136
-
137
-
138
-
139
-
140
-
141
-
142
-
143
-
144
-
145
-
146
-
147
-
148
-
149
-
150
-
151
-
152
-
153
-
154
 |
 |

Table of Contents
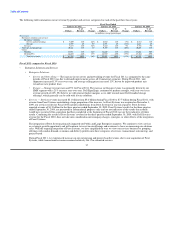
The table below presents a reconciliation of our non-GAAP financial measures to the most comparable GAAP measure for each of the
past three fiscal years:
Fiscal Year Ended
January 28, January 29, January 30,
2011 % Change 2010 % Change 2009
(in millions, except percentages)
GAAP gross margin $ 11,396 23% $ 9,261 (15%) $ 10,957
Non-GAAP adjustments:
Amortization of intangibles 278 151 59
Severance and facility actions 53 236 146
Acquisition-related 4 1 -
Stock-option accelerated vesting charges - - 16
Non-GAAP gross margin $ 11,731 22% $ 9,649 (14%) $ 11,178
GAAP operating expenses $ 7,963 12% $ 7,089 (9%) $ 7,767
Non-GAAP adjustments:
Amortization of intangibles (71) (54) (46)
Severance and facility actions (76) (245) (136)
Acquisition-related (94) (115) -
Stock-option accelerated vesting charges - - (88)
Other fees and settlements (140) - -
Non-GAAP operating expenses $ 7,582 14% $ 6,675 (11%) $ 7,497
GAAP operating income $ 3,433 58% $ 2,172 (32%) $ 3,190
Non-GAAP adjustments:
Amortization of intangibles 349 205 105
Severance and facility actions 129 481 282
Acquisition-related 98 116 -
Stock-option accelerated vesting charges - - 104
Other fees and settlements 140 - -
Non-GAAP operating income $ 4,149 40% $ 2,974 (19%) $ 3,681
GAAP net income $ 2,635 84% $ 1,433 (42%) $ 2,478
Non-GAAP adjustments:
Amortization of intangibles 349 205 105
Severance and facility actions 129 481 282
Acquisition-related 98 116 -
Stock-option accelerated vesting charges - - 104
Other fees and settlements 68 - -
Aggregate adjustments for income taxes (173) (181) (117)
Non-GAAP net income $ 3,106 51% $ 2,054 (28%) $ 2,852
GAAP earnings per share — diluted $ 1.35 85% $ 0.73 (42%) $ 1.25
Non-GAAP adjustments per share — diluted 0.24 0.32 0.19
Non-GAAP earnings per share — diluted $ 1.59 51% $ 1.05 (27%) $ 1.44
32