Dell 2010 Annual Report Download - page 41
Download and view the complete annual report
Please find page 41 of the 2010 Dell annual report below. You can navigate through the pages in the report by either clicking on the pages listed below, or by using the keyword search tool below to find specific information within the annual report.-
 1
1 -
2
-
3
-
4
-
5
-
6
-
7
-
8
-
9
-
10
-
11
-
12
-
13
-
14
-
15
-
16
-
17
-
18
-
19
-
20
-
21
-
22
-
23
-
24
-
25
-
26
-
27
-
28
-
29
-
30
-
 31
31 -
 32
32 -
 33
33 -
 34
34 -
 35
35 -
 36
36 -
 37
37 -
 38
38 -
 39
39 -
 40
40 -
 41
41 -
 42
42 -
 43
43 -
 44
44 -
 45
45 -
 46
46 -
 47
47 -
 48
48 -
 49
49 -
 50
50 -
 51
51 -
52
-
53
-
54
-
55
-
56
-
57
-
58
-
59
-
60
-
61
-
62
-
63
-
64
-
65
-
66
-
67
-
68
-
69
-
70
-
71
-
72
-
73
-
74
-
75
-
76
-
77
-
78
-
79
-
80
-
81
-
82
-
83
-
84
-
85
-
86
-
87
-
88
-
89
-
90
-
91
-
92
-
93
-
94
-
95
-
96
-
97
-
98
-
99
-
100
-
101
-
102
-
103
-
104
-
105
-
106
-
107
-
108
-
109
-
110
-
111
-
112
-
113
-
114
-
115
-
116
-
117
-
118
-
119
-
120
-
121
-
122
-
123
-
124
-
125
-
126
-
127
-
128
-
129
-
130
-
131
-
132
-
133
-
134
-
135
-
136
-
137
-
138
-
139
-
140
-
141
-
142
-
143
-
144
-
145
-
146
-
147
-
148
-
149
-
150
-
151
-
152
-
153
-
154
 |
 |

Table of Contents
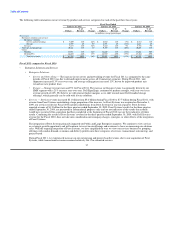
The following table summarizes our net revenue by product and services categories for each of the past three fiscal years:
Fiscal Year Ended
January 28, 2011 January 29, 2010 January 30, 2009
% of % % of % % of
Dollars Revenue Change Dollars Revenue Change Dollars Revenue
(in millions, except percentages)
Net revenue:
Enterprise solutions and services:
Enterprise solutions:
Servers and networking $ 7,609 12% 26% $ 6,032 11% (7%) $ 6,512 11%
Storage 2,295 4% 5% 2,192 4% (18%) 2,667 4%
Services 7,673 12% 36% 5,622 11% 5% 5,351 9%
Software and peripherals 10,261 17% 8% 9,499 18% (10%) 10,603 17%
Client:
Mobility 18,971 31% 14% 16,610 31% (11%) 18,604 30%
Desktop PCs 14,685 24% 13% 12,947 25% (25%) 17,364 29%
Total net revenue $ 61,494 100% 16% $ 52,902 100% (13%) $ 61,101 100%
Fiscal 2011 compared to Fiscal 2010
– Enterprise Solutions and Services
• Enterprise Solutions:
• Servers and Networking — The increase in our servers and networking revenue for Fiscal 2011 as compared to the same
periods of Fiscal 2010 was due to demand improvements across all Commercial segments. During Fiscal 2011, unit
shipments increased 13% year-over-year, and average selling prices increased 12%, driven by improved product mix
toward our new product lines.
• Storage — Storage revenue increased 5% for Fiscal 2011. The increase in Storage revenue was primarily driven by our
SMB segment with a 21% increase year-over-year. Dell EqualLogic continued to perform strongly, with year-over-year
revenue growth of 62%. We believe we will generate higher margins as we shift towards more Dell-branded storage
offerings, which generally can be sold with service solutions.
• Services — Services revenue increased $2.1 billion from $5.6 billion during Fiscal 2010 to $7.7 billion during Fiscal 2011, with
revenue from Perot Systems contributing a large proportion of the increase. As Perot Systems was acquired on November 3,
2009, our services results for Fiscal 2010 include contributions from Perot Systems for one fiscal quarter. Perot Systems
reported revenue of $1.9 billion for the three quarters ended September 30, 2009. Perot Systems' results for the three quarters
ended September 30, 2009, are presented for informational purposes only and are not indicative of the results that actually
would have occurred if the acquisition had been completed at the beginning of Fiscal 2010, nor are they indicative of future
results. Combining the results of Perot Systems' revenue for the three quarters ended September 30, 2009, with Dell Services
revenue for the Fiscal 2010, does not take into consideration intercompany charges, synergies, or other effects of the integration
of Perot Systems.
The integration of Perot Systems primarily impacted our Public and Large Enterprise segments. We continue to view services
as a strategic growth opportunity and will continue to invest in our offerings and resources to focus on increasing our solutions
sales. With the ongoing integration of Perot Systems, we have simplified the way we view our services business by grouping
offerings with similar demand, economic and delivery profiles into three categories of services: transactional; outsourcing; and
project-based.
During Fiscal 2011, we experienced increases in our outsourcing and project-based revenues, due to our acquisition of Perot
Systems, while transactional revenues remained relatively flat. Our estimated services
37