Dell 2010 Annual Report Download - page 38
Download and view the complete annual report
Please find page 38 of the 2010 Dell annual report below. You can navigate through the pages in the report by either clicking on the pages listed below, or by using the keyword search tool below to find specific information within the annual report.-
 1
1 -
2
-
3
-
4
-
5
-
6
-
7
-
8
-
9
-
10
-
11
-
12
-
13
-
14
-
15
-
16
-
17
-
18
-
19
-
20
-
21
-
22
-
23
-
24
-
25
-
26
-
27
-
 28
28 -
 29
29 -
 30
30 -
 31
31 -
 32
32 -
 33
33 -
 34
34 -
 35
35 -
 36
36 -
 37
37 -
 38
38 -
 39
39 -
 40
40 -
 41
41 -
 42
42 -
 43
43 -
 44
44 -
 45
45 -
 46
46 -
 47
47 -
 48
48 -
49
-
50
-
51
-
52
-
53
-
54
-
55
-
56
-
57
-
58
-
59
-
60
-
61
-
62
-
63
-
64
-
65
-
66
-
67
-
68
-
69
-
70
-
71
-
72
-
73
-
74
-
75
-
76
-
77
-
78
-
79
-
80
-
81
-
82
-
83
-
84
-
85
-
86
-
87
-
88
-
89
-
90
-
91
-
92
-
93
-
94
-
95
-
96
-
97
-
98
-
99
-
100
-
101
-
102
-
103
-
104
-
105
-
106
-
107
-
108
-
109
-
110
-
111
-
112
-
113
-
114
-
115
-
116
-
117
-
118
-
119
-
120
-
121
-
122
-
123
-
124
-
125
-
126
-
127
-
128
-
129
-
130
-
131
-
132
-
133
-
134
-
135
-
136
-
137
-
138
-
139
-
140
-
141
-
142
-
143
-
144
-
145
-
146
-
147
-
148
-
149
-
150
-
151
-
152
-
153
-
154
 |
 |

Table of Contents
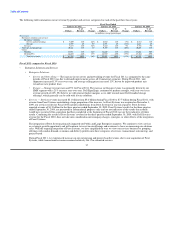
Fiscal 2011 compared to Fiscal 2010
• Large Enterprise — The year-over-year increase in Large Enterprise's revenue for Fiscal 2011 was mainly attributable to improved
demand due to an ongoing hardware refresh among our Large Enterprise customers. Large Enterprise experienced year-over-year
increases in revenue across all product lines during Fiscal 2011, except for storage revenue, which declined 5%. The decrease in
storage revenue is primarily due to a decrease in the sale of third-party storage products as we shift towards more Dell-branded
storage solutions. Revenue from servers and networking and services increased 33% and 35%, respectively. The increase in services
revenue was largely due to the acquisition of Perot Systems in Fiscal 2010. Sales of client products generated large revenue increases
with mobility and desktop PCs revenue increasing 33% and 25%, year-over-year, respectively. During Fiscal 2011, Large
Enterprise's revenue increased year-over-year across all regions.
During Fiscal 2011, operating income as a percentage of revenue increased 260 basis points year-over-year to 8.3%. The increase
was mostly driven by improvements in gross margin due to a shift in gross margin mix to enterprise solutions and services, improved
component costs, better product quality, and improved pricing discipline, particularly in the latter half of Fiscal 2011 for client
products. Revenue increases and tighter spending controls on operating expenses resulted in a decrease in operating expenses as a
percentage of net revenue.
• Public — During Fiscal 2011, Public experienced a year-over-year increase in revenue across all product and service categories.
Services contributed the largest increase, with a 69% increase in revenue over the prior year. The increase in services revenue was
primarily a result of our acquisition of Perot Systems in Fiscal 2010. Revenue from servers and networking and storage increased
15% and 8% year-over-year, respectively. Software and peripherals revenue increased 10% year-over-year. Revenue from mobility
and desktop PCs increased 5% and 6% year-over-year, respectively. Public's revenue grew during Fiscal 2011 across the Americas
and the Asia-Pacific region, but declined in Europe due to budgetary constraints on public spending.
Public's operating income percentage declined 60 basis points to 8.8% for Fiscal 2011 due to a year-over-year increase in operating
expenses as a percentage of revenue, offset in part by a slight increase in gross margin percentage. The increase in operating expenses
was a result of higher selling and marketing costs.
• Small and Medium Business — During Fiscal 2011, SMB experienced a year-over-year increase in revenue with increases across all
product and services categories. Servers and networking, and storage revenue increased 26% and 21% year-over-year, respectively.
Revenue from mobility and desktop PCs increased 20% and 23% year-over-year, respectively, while software and peripherals
revenue increased 16% year-over-year. The improved demand environment was a major contributor to the increase in revenue for all
product categories. Services revenue increased 6% year-over-year. SMB revenue experienced year-over-year growth across all
regions during Fiscal 2011. SMB revenue from BRIC grew 40% year-over-year.
Operating income percentage increased 160 basis points to 10.2%. The increase in operating income percentage was attributable to
improved gross margins as a result of lower component costs and an improved pricing environment, as well as to a decrease in
operating expenses as a percentage of revenue due to tighter spending controls.
• Consumer — Consumer's revenue increased 3% year-over-year during Fiscal 201l. Revenue from all product and services categories
decreased year-over-year for Fiscal 2011, except mobility. Consumer mobility revenue increased by 8% year-over-year, due to
increase of 8% in mobility units sold, while revenue from desktops PCs decreased by 1% due to a decline in desktop PC units of 2%.
Average selling prices for Consumer mobility and desktop PCs were relatively flat year-over-year during Fiscal 2011. The increase in
mobility revenue was due to improved unit demand for Consumer mobility products. Consumer services decreased 11%
year-over-year and software and peripherals revenue decreased 10% for the same period. We continue to see a shift in sales mix from
direct to retail sales. which typically has lower attach rates for services and software and peripherals. At a country level, our
U.S. Consumer revenue decreased 9% year-over-year due to softer demand, while our non-U.S. regions experienced 16% revenue
growth. Revenue from BRIC grew 46% year-over-year for Fiscal 2011.
34