Dell 2010 Annual Report Download - page 37
Download and view the complete annual report
Please find page 37 of the 2010 Dell annual report below. You can navigate through the pages in the report by either clicking on the pages listed below, or by using the keyword search tool below to find specific information within the annual report.-
 1
1 -
2
-
3
-
4
-
5
-
6
-
7
-
8
-
9
-
10
-
11
-
12
-
13
-
14
-
15
-
16
-
17
-
18
-
19
-
20
-
21
-
22
-
23
-
24
-
25
-
26
-
 27
27 -
 28
28 -
 29
29 -
 30
30 -
 31
31 -
 32
32 -
 33
33 -
 34
34 -
 35
35 -
 36
36 -
 37
37 -
 38
38 -
 39
39 -
 40
40 -
 41
41 -
 42
42 -
 43
43 -
 44
44 -
 45
45 -
 46
46 -
 47
47 -
48
-
49
-
50
-
51
-
52
-
53
-
54
-
55
-
56
-
57
-
58
-
59
-
60
-
61
-
62
-
63
-
64
-
65
-
66
-
67
-
68
-
69
-
70
-
71
-
72
-
73
-
74
-
75
-
76
-
77
-
78
-
79
-
80
-
81
-
82
-
83
-
84
-
85
-
86
-
87
-
88
-
89
-
90
-
91
-
92
-
93
-
94
-
95
-
96
-
97
-
98
-
99
-
100
-
101
-
102
-
103
-
104
-
105
-
106
-
107
-
108
-
109
-
110
-
111
-
112
-
113
-
114
-
115
-
116
-
117
-
118
-
119
-
120
-
121
-
122
-
123
-
124
-
125
-
126
-
127
-
128
-
129
-
130
-
131
-
132
-
133
-
134
-
135
-
136
-
137
-
138
-
139
-
140
-
141
-
142
-
143
-
144
-
145
-
146
-
147
-
148
-
149
-
150
-
151
-
152
-
153
-
154
 |
 |

Table of Contents
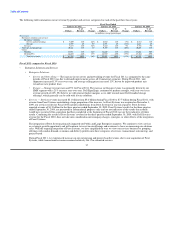
Fiscal Year Ended
January 28, January 29, January 30,
2011 2010 2009
Percentage of Total Net Revenue
GAAP gross margin 18.5% 17.5% 17.9%
Non-GAAP adjustments 0.6% 0.7% 0.4%
Non-GAAP gross margin 19.1% 18.2% 18.3%
GAAP operating expenses 12.9% 13.4% 12.7%
Non-GAAP adjustments (0.6%) (0.8%) (0.4%)
Non-GAAP operating expenses 12.3% 12.6% 12.3%
GAAP operating income 5.6% 4.1% 5.2%
Non-GAAP adjustments 1.1% 1.5% 0.8%
Non-GAAP operating income 6.7% 5.6% 6.0%
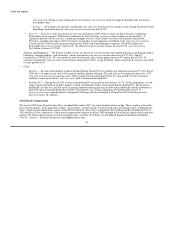
Segment Discussion
Our four global business segments are Large Enterprise, Public, Small and Medium Business, and Consumer.
Severance and facility action expenses, broad based long-term incentive expenses, amortization of purchased intangible assets costs,
acquisition-related expenses, and charges related to our settlement of the SEC investigation as well as a securities litigation class action
lawsuit that were incurred during Fiscal 2011, are not allocated to the reporting segments as management does not believe that these
items are reflective of the underlying operating performance of the reporting segments. These costs totaled $1.1 billion, $1.2 billion, and
$805 million during Fiscal 2011, Fiscal 2010, and Fiscal 2009, respectively.
See Note 16 of Notes to Consolidated Financial Statements included in "Part II — Item 8 — Financial Statements and Supplementary
Data" for additional information and reconciliation of segment revenue and operating income to consolidated revenue and operating
income.
The following table presents our net revenue and operating income by our reportable global segments:
Fiscal Year Ended
January 28, 2011 January 29, 2010 January 30, 2009
% of % % of % % of
Dollars Revenue(a) Change Dollars Revenue(a) Change Dollars Revenue(a)
(in millions, except percentages)
Large Enterprise
Net revenue $ 17,813 29% 25% $ 14,285 27% (21%) $ 18,011 30%
Operating income $ 1,473 8% 80% $ 819 6% (29%) $ 1,158 6%
Public
Net revenue $ 16,851 27% 16% $ 14,484 27% (6%) $ 15,338 25%
Operating income $ 1,484 9% 9% $ 1,361 9% 8% $ 1,258 8%
Small and Medium Business
Net revenue $ 14,473 24% 20% $ 12,079 23% (19%) $ 14,892 24%
Operating income $ 1,477 10% 42% $ 1,040 9% (18%) $ 1,273 9%
Consumer
Net revenue $ 12,357 20% 3% $ 12,054 23% (6%) $ 12,860 21%
Operating income $ 65 1% (39%) $ 107 1% (65%) $ 306 2%
(a) Operating income percentage of revenue is stated in relation to the respective segment.
33