Dell 2010 Annual Report Download - page 51
Download and view the complete annual report
Please find page 51 of the 2010 Dell annual report below. You can navigate through the pages in the report by either clicking on the pages listed below, or by using the keyword search tool below to find specific information within the annual report.-
 1
1 -
2
-
3
-
4
-
5
-
6
-
7
-
8
-
9
-
10
-
11
-
12
-
13
-
14
-
15
-
16
-
17
-
18
-
19
-
20
-
21
-
22
-
23
-
24
-
25
-
26
-
27
-
28
-
29
-
30
-
31
-
32
-
33
-
34
-
35
-
36
-
37
-
38
-
39
-
40
-
 41
41 -
 42
42 -
 43
43 -
 44
44 -
 45
45 -
 46
46 -
 47
47 -
 48
48 -
 49
49 -
 50
50 -
 51
51 -
 52
52 -
 53
53 -
 54
54 -
 55
55 -
 56
56 -
 57
57 -
 58
58 -
 59
59 -
 60
60 -
 61
61 -
62
-
63
-
64
-
65
-
66
-
67
-
68
-
69
-
70
-
71
-
72
-
73
-
74
-
75
-
76
-
77
-
78
-
79
-
80
-
81
-
82
-
83
-
84
-
85
-
86
-
87
-
88
-
89
-
90
-
91
-
92
-
93
-
94
-
95
-
96
-
97
-
98
-
99
-
100
-
101
-
102
-
103
-
104
-
105
-
106
-
107
-
108
-
109
-
110
-
111
-
112
-
113
-
114
-
115
-
116
-
117
-
118
-
119
-
120
-
121
-
122
-
123
-
124
-
125
-
126
-
127
-
128
-
129
-
130
-
131
-
132
-
133
-
134
-
135
-
136
-
137
-
138
-
139
-
140
-
141
-
142
-
143
-
144
-
145
-
146
-
147
-
148
-
149
-
150
-
151
-
152
-
153
-
154
 |
 |

Table of Contents
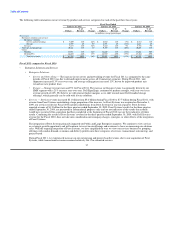
Key Performance Metrics — Our cash conversion cycle for the fiscal quarter ended January 28, 2011 deteriorated from the fiscal quarter
ended January 29, 2010 and improved from the fiscal quarter ended January 30, 2009. Our business model allows us to maintain an
efficient cash conversion cycle, which compares favorably with that of others in our industry.
The following table presents the components of our cash conversion cycle for the fourth quarter of each of the past three fiscal years:
Fiscal Quarter Ended
January 28, January 29, January 30,
2011 2010 2009
Days of sales outstanding(a) 40 38 35
Days of supply in inventory(b) 9 8 7
Days in accounts payable(c) (82) (82) (67)
Cash conversion cycle (33) (36) (25)
(a) Days of sales outstanding ("DSO") calculates the average collection period of our receivables. DSO is based on the ending net trade receivables and the most recent
quarterly revenue for each period. DSO also includes the effect of product costs related to customer shipments not yet recognized as revenue that are classified in
other current assets. DSO is calculated by adding accounts receivable, net of allowance for doubtful accounts, and customer shipments in transit and dividing that
sum by average net revenue per day for the current quarter (90 days). At January 28, 2011, January 29, 2010 and January 30, 2009, DSO and days of customer
shipments not yet recognized were 37 and 3 days, 35 and 3 days, and 31 and 4 days, respectively.
(b) Days of supply in inventory ("DSI") measures the average number of days from procurement to sale of our product. DSI is based on ending inventory and most
recent quarterly cost of sales for each period. DSI is calculated by dividing inventory by average cost of goods sold per day for the current quarter (90 days).
(c) Days in accounts payable ("DPO") calculates the average number of days our payables remain outstanding before payment. DPO is based on ending accounts
payable and most recent quarterly cost of sales for each period. DPO is calculated by dividing accounts payable by average cost of goods sold per day for the
current quarter (90 days).
Our cash conversion cycle decreased three days at January 28, 2011, from January 29, 2010, driven by a two day increase in DSO and a
one day increase in DSI. DPO was flat year-over-year. The increase in DSO from January 29, 2010, was due to growth in our commercial
business, which typically has longer payment terms. The slight increase in DSI from January 29, 2010, was primarily attributable to the
optimization of our supply chain requiring an increase in strategic purchases of materials and finished goods inventory.
Our cash conversion cycle improved by 11 days at January 29, 2010, from January 30, 2009, driven by a 15 day improvement in DPO,
the effect of which was partially offset by a three day increase in DSO and one day increase in DSI. The improvement in DPO from
January 30, 2009, was attributable to our ongoing transition to contract manufacturing, further standardization of vendor agreements, and
the timing of supplier purchases and payments during Fiscal 2010 as compared to Fiscal 2009. The increase in DSO from January 30,
2009, was primarily attributable to our growth in consumer retail, whose customers typically have longer payment terms, and to foreign
currency movements due to the slight weakening of the U.S. Dollar, the effects of which were partially offset by a reduction in past-due
receivables. The deterioration in DSI from January 30, 2009, was primarily attributable to an increase in finished goods inventory and
strategic materials purchases.
We defer the cost of revenue associated with customer shipments not yet recognized as revenue until these shipments are delivered.
These deferred costs are included in our reported DSO because we believe this reporting results in a more accurate presentation of our
DSO and cash conversion cycle. These deferred costs are recorded in other current assets in our Consolidated Statements of Financial
Position and totaled $541 million, $523 million, and $556 million, at January 28, 2011, January 29, 2010, and January 30, 2009,
respectively.
We believe that we can generate cash flow from operations in excess of net income over the long term and can operate our cash
conversion cycle at mid negative 30 days or better.
47