Dell 2010 Annual Report Download - page 42
Download and view the complete annual report
Please find page 42 of the 2010 Dell annual report below. You can navigate through the pages in the report by either clicking on the pages listed below, or by using the keyword search tool below to find specific information within the annual report.-
 1
1 -
2
-
3
-
4
-
5
-
6
-
7
-
8
-
9
-
10
-
11
-
12
-
13
-
14
-
15
-
16
-
17
-
18
-
19
-
20
-
21
-
22
-
23
-
24
-
25
-
26
-
27
-
28
-
29
-
30
-
31
-
 32
32 -
 33
33 -
 34
34 -
 35
35 -
 36
36 -
 37
37 -
 38
38 -
 39
39 -
 40
40 -
 41
41 -
 42
42 -
 43
43 -
 44
44 -
 45
45 -
 46
46 -
 47
47 -
 48
48 -
 49
49 -
 50
50 -
 51
51 -
 52
52 -
53
-
54
-
55
-
56
-
57
-
58
-
59
-
60
-
61
-
62
-
63
-
64
-
65
-
66
-
67
-
68
-
69
-
70
-
71
-
72
-
73
-
74
-
75
-
76
-
77
-
78
-
79
-
80
-
81
-
82
-
83
-
84
-
85
-
86
-
87
-
88
-
89
-
90
-
91
-
92
-
93
-
94
-
95
-
96
-
97
-
98
-
99
-
100
-
101
-
102
-
103
-
104
-
105
-
106
-
107
-
108
-
109
-
110
-
111
-
112
-
113
-
114
-
115
-
116
-
117
-
118
-
119
-
120
-
121
-
122
-
123
-
124
-
125
-
126
-
127
-
128
-
129
-
130
-
131
-
132
-
133
-
134
-
135
-
136
-
137
-
138
-
139
-
140
-
141
-
142
-
143
-
144
-
145
-
146
-
147
-
148
-
149
-
150
-
151
-
152
-
153
-
154
 |
 |

Table of Contents
backlog as of January 28, 2011 and January 29, 2010, was $13.9 billion and $12.8 billion, respectively. We provide information
regarding services backlog because we believe it provides useful trend information regarding changes in the size of our services
business over time. Services backlog, as defined by us, includes deferred services revenue and contracted services backlog.
Deferred services revenue, which consists primarily of our extended warranties, was $6.7 billion and $6.1 billion as of
January 28, 2011 and January 29, 2010, respectively. Estimated contracted services backlog, which is primarily related to our
outsourcing services business, was $7.2 billion and $6.7 billion, as of January 28, 2011 and January 29, 2010, respectively.
While there are no third-party standards or requirements governing the calculation of contracted services backlog, our estimated
contracted services backlog represents signed contracts initially exceeding $2 million in total expected revenue and having an
initial contract term exceeding 18 months. The terms of the signed services contracts included in our calculation of services
backlog are subject to change and are affected by terminations, changes in the scope of services, and changes to other factors
that could impact the value of the contract. For these and other reasons, it is not reasonably practicable to estimate the portions
for these backlog amounts that will ultimately be recognized as revenue when performance on the contracts is completed.
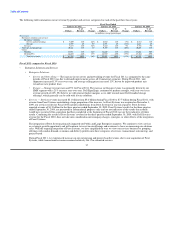
– Software and Peripherals — Revenue from sales of software and peripherals ("S&P") is derived from sales of Dell-branded printers,
monitors (not sold with systems), projectors, keyboards, mice, docking stations, and a multitude of third-party peripherals, including
televisions, cameras, stand-alone software sales and related support services, and other products. The 8% increase in S&P revenue for
Fiscal 2011 was driven by overall customer unit shipment increases due to sales of displays and electronics and peripherals, which
experienced a combined year-over-year revenue increase of 15% for Fiscal 2011, while revenue from imaging products decreased by
6%.
Software revenue from our S&P line of business, which includes stand alone sales of software license fees and related post-contract
customer support, is reported in services revenue, including software related on our Consolidated Statements of Income. Software
and related support services revenue represented 33% and 39% of services revenue, including software related for Fiscal 2011 and
Fiscal 2010, respectively.
– Client
• Mobility — Revenue from mobility products (which include notebook computers, mobile workstations, and smartphones)
increased 14% during Fiscal 2011 across all operating segments due to demand improvements. Mobility units increased 14%,
while average selling prices remained flat during Fiscal 2011. During Fiscal 2011, overall Commercial mobility revenue
increased 19% year-over-year, and revenue from Consumer mobility increased 8%. The increase in Commercial mobility was
driven by increases in demand for our Latitude notebooks. We believe the on-going demand trend towards mobility products
will continue, and we plan to address this demand by expanding our product platforms to cover broader feature sets and price
bands.
• Desktop PCs — During Fiscal 2011, revenue from desktop PCs (which include desktop computer systems and fixed
workstations) increased as unit demand for desktop PCs increased by 10%. The average selling price for our desktop computers
increased by 3% year-over-year due to a slight shift in product mix to higher priced units. The increase in unit demand was
driven by our Large Enterprise and SMB customers, generating 25% and 23%, respectively, increases in revenue year-over-year
for Fiscal 2011. These increases were driven primarily by the stronger demand for our Optiplex desktop PCs and fixed work
stations. In the consumer marketplace, we are continuing to see rising end-user demand for mobility products, which moderates
the demand for desktop PCs.
Fiscal 2010 compared to Fiscal 2009
– Enterprise Solutions and Services
• Enterprise Solutions
• Servers and Networking — The decline in our servers and networking revenue during Fiscal 2010 was due to demand
challenges across all Commercial segments and regions. Unit shipments decreased 12%
38