Dell 2010 Annual Report Download - page 44
Download and view the complete annual report
Please find page 44 of the 2010 Dell annual report below. You can navigate through the pages in the report by either clicking on the pages listed below, or by using the keyword search tool below to find specific information within the annual report.-
 1
1 -
2
-
3
-
4
-
5
-
6
-
7
-
8
-
9
-
10
-
11
-
12
-
13
-
14
-
15
-
16
-
17
-
18
-
19
-
20
-
21
-
22
-
23
-
24
-
25
-
26
-
27
-
28
-
29
-
30
-
31
-
32
-
33
-
 34
34 -
 35
35 -
 36
36 -
 37
37 -
 38
38 -
 39
39 -
 40
40 -
 41
41 -
 42
42 -
 43
43 -
 44
44 -
 45
45 -
 46
46 -
 47
47 -
 48
48 -
 49
49 -
 50
50 -
 51
51 -
 52
52 -
 53
53 -
 54
54 -
55
-
56
-
57
-
58
-
59
-
60
-
61
-
62
-
63
-
64
-
65
-
66
-
67
-
68
-
69
-
70
-
71
-
72
-
73
-
74
-
75
-
76
-
77
-
78
-
79
-
80
-
81
-
82
-
83
-
84
-
85
-
86
-
87
-
88
-
89
-
90
-
91
-
92
-
93
-
94
-
95
-
96
-
97
-
98
-
99
-
100
-
101
-
102
-
103
-
104
-
105
-
106
-
107
-
108
-
109
-
110
-
111
-
112
-
113
-
114
-
115
-
116
-
117
-
118
-
119
-
120
-
121
-
122
-
123
-
124
-
125
-
126
-
127
-
128
-
129
-
130
-
131
-
132
-
133
-
134
-
135
-
136
-
137
-
138
-
139
-
140
-
141
-
142
-
143
-
144
-
145
-
146
-
147
-
148
-
149
-
150
-
151
-
152
-
153
-
154
 |
 |

Table of Contents
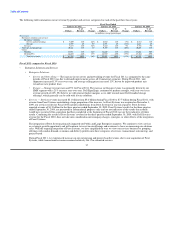
Interest and Other, net
The following table provides a detailed presentation of interest and other, net for Fiscal 2011, 2010, and 2009:
Fiscal Year Ended
January 28, January 29, January 30,
2011 2010 2009
(in millions)
Interest and other, net:
Investment income, primarily interest $ 47 $ 57 $ 180
Gains (losses) on investments, net 6 2 (10)
Interest expense (199) (160) (93)
Foreign exchange 4 (59) 115
Other 59 12 (58)
Interest and other, net $ (83) $ (148) $ 134
Fiscal 2011 compared to Fiscal 2010
We continued to maintain a portfolio of instruments with shorter maturities, which typically carry lower market yields. During Fiscal
2011, our investment income declined slightly, even with higher average balances, primarily due to a continued declined in market yields.
Overall investment yield in Fiscal 2011 declined from approximately 48 basis points during Fiscal 2010 to approximately 35 basis points.
The year-over-year increase in interest expense for Fiscal 2011 was due to higher debt levels, which increased to $6.0 billion as of
January 28, 2011, from $4.1 billion as of January 29, 2010.
The year-over-year change in foreign exchange for Fiscal 2011 was primarily due to gains from revaluation of certain un-hedged foreign
currency balances, partially offset by increases in the costs associated with the hedge program.
Other includes a $72 million merger termination fee received during Fiscal 2011.
Fiscal 2010 compared to Fiscal 2009
During Fiscal 2010, our investment income declined, even with higher average balances, primarily due to a decrease in market yields.
Increased long-term and short-term debt during Fiscal 2010 resulted in increased interest expense.
Other, in the table above, primarily reflects the fair market value adjustments related to our deferred compensation plan investments. We
recognized a $24 million increase and a $35 million decline in the fair market values of our deferred compensation plan investments
during Fiscal 2010 and Fiscal 2009, respectively.
The year-over-year decrease in foreign exchange for Fiscal 2010, as compared to Fiscal 2009, was primarily due to increased costs on our
hedge program, as well as revaluation on balances in un-hedged currencies, as most foreign currencies strengthened relative to the U.S.
Dollar during Fiscal 2010. In addition, for Fiscal 2009, a $42 million gain resulted from the correction of errors in the remeasurement of
certain local currency balances to the functional currency in prior periods.
Income and Other Taxes
Our effective tax rate was 21.3%, 29.2%, and 25.4% for Fiscal 2011, 2010, and 2009, respectively. The decrease in our effective income
tax rate for Fiscal 2011 as compared to Fiscal 2010, was primarily due to an increase in the proportion of taxable income attributable to
lower tax jurisdictions during Fiscal 2011. The differences between our effective tax rate and the U.S. federal statutory rate of 35%
principally resulted from our geographical distribution of taxable income and permanent differences between the book and tax treatment
of certain items. The increase in our effective income tax rate for Fiscal 2010 from Fiscal 2009 was primarily due to an increased mix of
profits in
40