GE 2011 Annual Report Download - page 2
Download and view the complete annual report
Please find page 2 of the 2011 GE annual report below. You can navigate through the pages in the report by either clicking on the pages listed below, or by using the keyword search tool below to find specific information within the annual report.-
 1
1 -
 2
2 -
 3
3 -
 4
4 -
 5
5 -
 6
6 -
 7
7 -
 8
8 -
 9
9 -
 10
10 -
 11
11 -
 12
12 -
 13
13 -
14
-
15
-
16
-
17
-
18
-
19
-
20
-
21
-
22
-
23
-
24
-
25
-
26
-
27
-
28
-
29
-
30
-
31
-
32
-
33
-
34
-
35
-
36
-
37
-
38
-
39
-
40
-
41
-
42
-
43
-
44
-
45
-
46
-
47
-
48
-
49
-
50
-
51
-
52
-
53
-
54
-
55
-
56
-
57
-
58
-
59
-
60
-
61
-
62
-
63
-
64
-
65
-
66
-
67
-
68
-
69
-
70
-
71
-
72
-
73
-
74
-
75
-
76
-
77
-
78
-
79
-
80
-
81
-
82
-
83
-
84
-
85
-
86
-
87
-
88
-
89
-
90
-
91
-
92
-
93
-
94
-
95
-
96
-
97
-
98
-
99
-
100
-
101
-
102
-
103
-
104
-
105
-
106
-
107
-
108
-
109
-
110
-
111
-
112
-
113
-
114
-
115
-
116
-
117
-
118
-
119
-
120
-
121
-
122
-
123
-
124
-
125
-
126
-
127
-
128
-
129
-
130
-
131
-
132
-
133
-
134
-
135
-
136
-
137
-
138
-
139
-
140
-
141
-
142
-
143
-
144
-
145
-
146
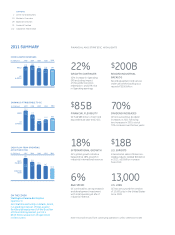
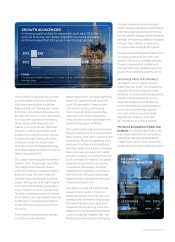
 |
 |

150
154
180
170
147
133
139
163
155 142
20082007 2009 2010 2011
CONSOLIDATED REVENUES
(In $ billions)
NBCU
GE
ex NBCU
16.8
16.0
20082007
GECS
Dividend
Industrial
CFOA
2009 2010 2011
19.1
23.3
16.4 14.7
12.1
CASH FLOW FROM OPERATING
ACTIVITIES (CFOA)
(In $ billions)
10.8
17.8
22.3
12.5 14.1
9.5
15.9
20.4
11.3 13.0
20082007 2009 2010 2011
EARNINGS ATTRIBUTABLE TO GE
(In $ billions)
NBCU
GE
ex NBCU
22%
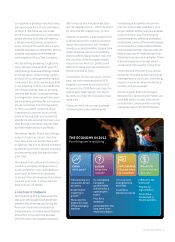
GROWTH CONTINUES
22% increase in Operating
EPS excluding impact
of the preferred stock
redemption, and 20% rise
in Operating earnings.
$200B
RECORD INDUSTRIAL
BACKLOG
Record equipment and service
orders drove the backlog to a
record of $200 billion.
$85B
FINANCIAL FLEXIBILITY
GE had $85 billion of cash and
equivalents at year-end 2011.
70%
DIVIDEND INCREASES
GE announced two dividend
increases in 2011 following
two increases in 2010: a total
70% increase over the two years.
18%
INTERNATIONAL GROWTH
GE’s global growth initiative
helped drive 18% growth in
industrial international revenue.
$18B
U.S. EXPORTS
International sales of American-
made products totaled $18 billion
in 2011, a $1 billion increase
from 2010.
6%
R&D SPEND
GE continued its strong research
and development investment
with total spending at 6% of
industrial revenue.
13,000
U.S. JOBS
GE has announced the creation
of 13,000 jobs in the United States
since 2009.
2011 SUMMARY fi nancial and strategic highlights
Note: Financial results from continuing operations unless otherwise noted.
CONTENTS
2 Letter to Shareowners
10 Business Overview
29 Board of Directors
31 Financial Section
142 Corporate Information
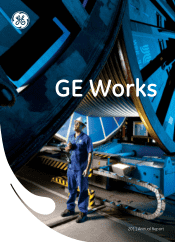
ON THE COVER
Wellington Pereira dos Santos
Operator II
GE’s Wellstream facility in Niterói, Brazil,
is a leading producer of high-quality
fl exible pipe equipment for the Brazilian
offshore drilling market, part of a
$500 million expansion of operations
in the country.