GE 2011 Annual Report Download - page 71
Download and view the complete annual report
Please find page 71 of the 2011 GE annual report below. You can navigate through the pages in the report by either clicking on the pages listed below, or by using the keyword search tool below to find specific information within the annual report.-
 1
1 -
2
-
3
-
4
-
5
-
6
-
7
-
8
-
9
-
10
-
11
-
12
-
13
-
14
-
15
-
16
-
17
-
18
-
19
-
20
-
21
-
22
-
23
-
24
-
25
-
26
-
27
-
28
-
29
-
30
-
31
-
32
-
33
-
34
-
35
-
36
-
37
-
38
-
39
-
40
-
41
-
42
-
43
-
44
-
45
-
46
-
47
-
48
-
49
-
50
-
51
-
52
-
53
-
54
-
55
-
56
-
57
-
58
-
59
-
60
-
 61
61 -
 62
62 -
 63
63 -
 64
64 -
 65
65 -
 66
66 -
 67
67 -
 68
68 -
 69
69 -
 70
70 -
 71
71 -
 72
72 -
 73
73 -
 74
74 -
 75
75 -
 76
76 -
 77
77 -
 78
78 -
 79
79 -
 80
80 -
 81
81 -
82
-
83
-
84
-
85
-
86
-
87
-
88
-
89
-
90
-
91
-
92
-
93
-
94
-
95
-
96
-
97
-
98
-
99
-
100
-
101
-
102
-
103
-
104
-
105
-
106
-
107
-
108
-
109
-
110
-
111
-
112
-
113
-
114
-
115
-
116
-
117
-
118
-
119
-
120
-
121
-
122
-
123
-
124
-
125
-
126
-
127
-
128
-
129
-
130
-
131
-
132
-
133
-
134
-
135
-
136
-
137
-
138
-
139
-
140
-
141
-
142
-
143
-
144
-
145
-
146
 |
 |

’
GE 2011 ANNUAL REPORT 69
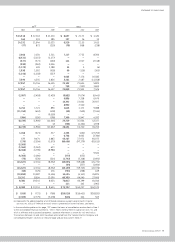
Selected Financial Data
The following table provides key information for Consolidated, GE and GECS.
(Dollars in millions; per-share amounts in dollars) 2011 2010 2009 2008 2007
GENERAL ELECTRIC COMPANY AND CONSOLIDATED AFFILIATES
Revenues $147,300 $149,593 $154,438 $179,837 $169,964
Earnings from continuing operations attributable to the Company 14,074 12,517 10,806 17,804 22,268
Earnings (loss) from discontinued operations, net of taxes,
attributable to the Company 77 (873) 219 (394) (60)
Net earnings attributable to the Company 14,151 11,644 11,025 17,410 22,208
Dividends declared (a) 7,498 5,212 6,785 12,649 11,713
Return on average GE shareowners’ equity (b) 11.9% 12.1% 11.6% 17.0% 22.0%
Per common share
Earnings from continuing operations—diluted $ 1.23 $ 1.14 $ 0.99 $ 1.76 $ 2.18
Earnings (loss) from discontinued operations—diluted 0.01 (0.08) 0.02 (0.04) (0.01)
Net earnings—diluted 1.23 1.06 1.01 1.72 2.17
Earnings from continuing operations—basic 1.23 1.14 0.99 1.76 2.19
Earnings (loss) from discontinued operations—basic 0.01 (0.08) 0.02 (0.04) (0.01)
Net earnings—basic 1.24 1.06 1.01 1.72 2.18
Dividends declared 0.61 0.46 0.61 1.24 1.15
Stock price range 21.65–14.02 19.70–13.75 17.52–5.87 38.52–12.58 42.15–33.90
Year-end closing stock price 17.91 18.29 15.13 16.20 37.07
Cash and equivalents 84,501 78,943 70,479 48,378 15,553
Total assets of continuing operations 715,987 735,368 756,943 773,531 756,526
Total assets 717,242 747,793 781,949 797,876 795,758
Long-term borrowings 243,459 293,323 336,172 320,522 314,977
Common shares outstanding—average (in thousands) 10,591,146 10,661,078 10,613,717 10,079,923 10,182,083
Common shareowner accounts—average 570,000 588,000 605,000 604,000 608,000
Employees at year end
United States (c) 131,000 121,000 122,000 139,000 141,000
Other countries (c) 170,000 152,000 168,000 169,000 170,000
NBCU —14,000 14,000 15,000 16,000
Total employees 301,000 287,000 304,000 323,000 327,000
GE DATA
Short-term borrowings $ 2,184 $ 456 $ 504 $ 2,375 $ 4,106
Long-term borrowings 9,405 9,656 11,681 9,827 11,656
Noncontrolling interests 1,006 4,098 5,797 6,678 6,503
GE shareowners’ equity 116,438 118,936 117,291 104,665 115,559
Total capital invested $129,033 $133,146 $135,273 $123,545 $137,824
Return on average total capital invested (b) 11.6% 11.8% 10.6% 15.7% 20.2%
Borrowings as a percentage of total capital invested (b) 9.0% 7.6% 9.0% 9.9% 11.4%
Working capital (b) $ (10) $ (1,618) $ (1,596) $ 3,904 $ 6,433
GECS DATA
Revenues $ 49,081 $ 49,881 $ 51,818 $ 68,609 $ 69,412
Earnings from continuing operations attributable to GECS 6,432 3,023 1,177 7,489 12,227
Earnings (loss) from discontinued operations, net of taxes,
attributable to GECS 78 (868) 238 (434) (1,926)
Net earnings attributable to GECS 6,510 2,155 1,415 7,055 10,301
GECS shareowner’s equity 77,110 68,984 70,833 53,279 57,676
Total borrowings and bank deposits 443,097 470,520 493,324 512,745 497,431
Ratio of debt to equity at GECS 5.75:1 (d) 6.82:1 (d) 6.96:1 (d) 9.62:1 8.62:1
Total assets $584,536 $605,255 $650,372 $661,009 $646,560
Transactions between GE and GECS have been eliminated from the consolidated information.
(a) Included $1,031 million of preferred stock dividends ($806 million related to our preferred stock redemption) in 2011, $300 million in both 2010 and 2009 and $75 million in 2008.
(b) Indicates terms are defined in the Glossary.
(c) Excludes NBCU.
(d) Ratios of 4.23:1, 5.25:1 and 5.39:1 for 2011, 2010 and 2009, respectively, net of cash and equivalents and with classification of hybrid debt as equity.