GE 2011 Annual Report Download - page 59
Download and view the complete annual report
Please find page 59 of the 2011 GE annual report below. You can navigate through the pages in the report by either clicking on the pages listed below, or by using the keyword search tool below to find specific information within the annual report.-
 1
1 -
2
-
3
-
4
-
5
-
6
-
7
-
8
-
9
-
10
-
11
-
12
-
13
-
14
-
15
-
16
-
17
-
18
-
19
-
20
-
21
-
22
-
23
-
24
-
25
-
26
-
27
-
28
-
29
-
30
-
31
-
32
-
33
-
34
-
35
-
36
-
37
-
38
-
39
-
40
-
41
-
42
-
43
-
44
-
45
-
46
-
47
-
48
-
 49
49 -
 50
50 -
 51
51 -
 52
52 -
 53
53 -
 54
54 -
 55
55 -
 56
56 -
 57
57 -
 58
58 -
 59
59 -
 60
60 -
 61
61 -
 62
62 -
 63
63 -
 64
64 -
 65
65 -
 66
66 -
 67
67 -
 68
68 -
 69
69 -
70
-
71
-
72
-
73
-
74
-
75
-
76
-
77
-
78
-
79
-
80
-
81
-
82
-
83
-
84
-
85
-
86
-
87
-
88
-
89
-
90
-
91
-
92
-
93
-
94
-
95
-
96
-
97
-
98
-
99
-
100
-
101
-
102
-
103
-
104
-
105
-
106
-
107
-
108
-
109
-
110
-
111
-
112
-
113
-
114
-
115
-
116
-
117
-
118
-
119
-
120
-
121
-
122
-
123
-
124
-
125
-
126
-
127
-
128
-
129
-
130
-
131
-
132
-
133
-
134
-
135
-
136
-
137
-
138
-
139
-
140
-
141
-
142
-
143
-
144
-
145
-
146
 |
 |

’
GE 2011 ANNUAL REPORT 57
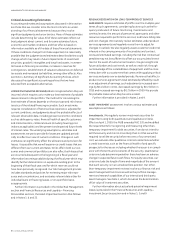
GECS Selected European Exposures
At December 31, 2011, we had $92 billion in fi nancing receivables to consumer and commercial customers in Europe. The GECS fi nancing
receivables portfolio in Europe is well diversifi ed across European geographies and customers. Approximately 85% of the portfolio is
secured by collateral and represents approximately 500,000 commercial customers. Several European countries, including Spain, Portugal,
Ireland, Italy, Greece and Hungary (“focus countries”), have been subject to credit deterioration due to weaknesses in their economic and
fi scal situations. The carrying value of GECS funded exposures in these focus countries and in the rest of Europe comprised the following at
December 31, 2011.
December 31, 2011 (In millions) Spain Portugal Ireland Italy Greece Hungary
Rest of
Europe
Total
Europe
Financing receivables, net of allowance for loan
losses (a) (b) $2,316 $601 $881 $7,231 $ 88 $3,060 $78,208 $92,385
Investments (c) (d) 2 — 24 611 36 152 2,650 3,475
Derivatives, net of collateral (c) (e) 47 — — 86 — — 177 310
Total funded exposures (f) $2,365 $601 $905 $7,928 $124 $3,212 $81,035 $96,170
Unfunded commitments $ — $ — $ — $ 311 $ — $ 557 $ 8,168 $ 9,036
(a) Financing receivable amounts are classified based on the location or nature of the related obligor.
(b) Substantially all relates to non-sovereign obligors. Includes residential mortgage loans of approximately $35.4 billion before consideration of purchased credit protection.
We have third-party mortgage insurance for approximately 28% of these residential mortgage loans, substantially all of which were originated in the U.K., Poland and
France.
(c) Investments and derivatives are classified based on the location of the parent of the obligor or issuer.
(d) Includes $1.1 billion related to financial institutions, $0.5 billion related to non-financial institutions and $1.9 billion related to sovereign issuers. Sovereign issuances totaled
$0.1 billion, $0.1 billion and $0.1 billion related to Italy, Hungary and Greece, respectively. We held no investments issued by sovereign entities in the other focus countries.
(e) Net of cash collateral, entire amount is non-sovereign.
(f) Excludes other GECS funded assets in European countries, which comprise cash and equivalents ($41.6 billion), ELTO ($11.9 billion), real estate held for investment ($7.3 billion),
and cost and equity method investments ($2.5 billion). GECS cash and equivalents in European countries include cash on short-term placement with highly rated global
financial institutions based in Europe, sovereign central banks and agencies or supranational entities ($24.2 billion) and the remaining $17.4 billion of cash and equivalents is
placed with highly rated European financial institutions on a short-term basis and is secured by U.S. Treasury securities ($9.6 billion) and sovereign bonds of non-focus
countries ($7.8 billion), where the value of our collateral exceeds the amount of our cash exposure.
We manage counterparty exposure, including credit risk, on an
individual counterparty basis. We place defi ned risk limits around
each obligor and review our risk exposure on the basis of both the
primary and parent obligor, as well as the issuer of securities held
as collateral. These limits are adjusted on an ongoing basis based
on our continuing assessment of the credit risk of the obligor or
issuer. In setting our counterparty risk limits, we focus on high
quality credits and diversifi cation through spread of risk in an
effort to actively manage our overall exposure. We actively moni-
tor each exposure against these limits and take appropriate
action when we believe that risk limits have been exceeded or
there are excess risk concentrations. Our collateral position and
ability to work out problem accounts has historically mitigated
our actual loss experience. Delinquency experience has been
improving in our European commercial and consumer platforms
in the aggregate, and we actively monitor and take action to
reduce exposures where appropriate. Uncertainties surrounding
European markets could have an impact on the judgments and
estimates used in determining the carrying value of these assets.
OTHER GECS RECEIVABLES totaled $13.4 billion at December 31,
2011 and $12.9 billion at December 31, 2010, and consisted pri-
marily of amounts due from GE (primarily related to material
procurement programs of $3.5 billion and $2.7 billion at
December 31, 2011 and December 31, 2010, respectively), insur-
ance receivables, nonfi nancing customer receivables, amounts
due under operating leases, amounts accrued from investment
income, tax receivables and various sundry items.
PROPERTY, PLANT AND EQUIPMENT totaled $65.7 billion at
December 31, 2011, down $0.5 billion from 2010, primarily refl ect-
ing a reduction in equipment leased to others principally as a
result of the disposal of our CLL marine container leasing busi-
ness. GE property, plant and equipment consisted of investments
for its own productive use, whereas the largest element for GECS
was equipment provided to third parties on operating leases.
Details by category of investment are presented in Note 7.
GE additions to property, plant and equipment totaled
$3.0 billion and $2.4 billion in 2011 and 2010, respectively. Total
expenditures, excluding equipment leased to others, for the past
fi ve years were $13.1 billion, of which 40% was investment for
growth through new capacity and product development; 24%
was investment in productivity through new equipment and pro-
cess improvements; and 36% was investment for other purposes
such as improvement of research and development facilities and
safety and environmental protection.
GECS additions to property, plant and equipment were
$9.9 billion and $7.7 billion during 2011 and 2010, respectively, pri-
marily refl ecting additions of commercial aircraft at GECAS.
GOODWILL AND OTHER INTANGIBLE ASSETS totaled $84.7 billion
and $74.4 billion, respectively, at December 31, 2011. Goodwill
increased $8.2 billion from 2010, primarily from the acquisitions of
Converteam, the Well Support division of John Wood Group PLC,
Dresser, Inc., Wellstream PLC and Lineage Power Holdings, Inc.,
partially offset by the stronger U.S. dollar. Other intangible assets
increased $2.1 billion from 2010, primarily from acquisitions,