GE 2011 Annual Report Download - page 91
Download and view the complete annual report
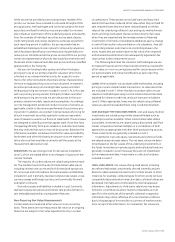
Please find page 91 of the 2011 GE annual report below. You can navigate through the pages in the report by either clicking on the pages listed below, or by using the keyword search tool below to find specific information within the annual report.-
 1
1 -
2
-
3
-
4
-
5
-
6
-
7
-
8
-
9
-
10
-
11
-
12
-
13
-
14
-
15
-
16
-
17
-
18
-
19
-
20
-
21
-
22
-
23
-
24
-
25
-
26
-
27
-
28
-
29
-
30
-
31
-
32
-
33
-
34
-
35
-
36
-
37
-
38
-
39
-
40
-
41
-
42
-
43
-
44
-
45
-
46
-
47
-
48
-
49
-
50
-
51
-
52
-
53
-
54
-
55
-
56
-
57
-
58
-
59
-
60
-
61
-
62
-
63
-
64
-
65
-
66
-
67
-
68
-
69
-
70
-
71
-
72
-
73
-
74
-
75
-
76
-
77
-
78
-
79
-
80
-
 81
81 -
 82
82 -
 83
83 -
 84
84 -
 85
85 -
 86
86 -
 87
87 -
 88
88 -
 89
89 -
 90
90 -
 91
91 -
 92
92 -
 93
93 -
 94
94 -
 95
95 -
 96
96 -
 97
97 -
 98
98 -
 99
99 -
 100
100 -
 101
101 -
102
-
103
-
104
-
105
-
106
-
107
-
108
-
109
-
110
-
111
-
112
-
113
-
114
-
115
-
116
-
117
-
118
-
119
-
120
-
121
-
122
-
123
-
124
-
125
-
126
-
127
-
128
-
129
-
130
-
131
-
132
-
133
-
134
-
135
-
136
-
137
-
138
-
139
-
140
-
141
-
142
-
143
-
144
-
145
-
146
 |
 |

GE 2011 ANNUAL REPORT 89
Note 3.
Investment Securities
Substantially all of our investment securities are classifi ed as available-for-sale. These comprise mainly investment grade debt securities
supporting obligations to annuitants, policyholders and holders of guaranteed investment contracts (GICs) in our run-off insurance operations
and Trinity, and investment securities at our treasury operations and investments held in our CLL business collateralized by senior secured
loans of high-quality, middle-market companies in a variety of industries. We do not have any securities classifi ed as held to maturity.
2011 2010
December 31 (In millions)
Amortized
cost
Gross
unrealized
gains
Gross
unrealized
losses
Estimated
fair value
Amortized
cost
Gross
unrealized
gains
Gross
unrealized
losses
Estimated
fair value
GE
Debt—U.S. corporate $ — $ — $ — $ — $ 1 $ — $ — $ 1
Equity—available-for-sale 18 — — 18 18 — — 18
18 — — 18 19 — — 19
GECS
Debt
U.S. corporate 20,748 3,432 (410) 23,770 20,815 1,576 (237) 22,154
State and municipal 3,027 350 (143) 3,234 2,961 45 (282) 2,724
Residential mortgage-backed (a) 2,711 184 (286) 2,609 3,092 95 (378) 2,809
Commercial mortgage-backed 2,913 162 (247) 2,828 3,009 145 (230) 2,924
Asset-backed 5,102 32 (164) 4,970 3,407 16 (193) 3,230
Corporate—non-U.S. 2,414 126 (207) 2,333 2,883 116 (132) 2,867
Government—non-U.S. 2,488 129 (86) 2,531 2,242 82 (58) 2,266
U.S. government and
federal agency 3,974 84 — 4,058 3,776 57 (47) 3,786
Retained interests 25 10 — 35 55 10 (26) 39
Equity
Available-for-sale 713 75 (38) 750 500 213 (8) 705
Trading 241 — — 241 417 — — 417
44,356 4,584 (1,581) 47,359 43,157 2,355 (1,591) 43,921
ELIMINATIONS (3) — — (3) (2) — — (2)
Total $44,371 $4,584 $(1,581) $47,374 $43,174 $2,355 $(1,591) $43,938
(a) Substantially collateralized by U.S. mortgages. Of our total residential mortgage-backed securities (RMBS) portfolio at December 31, 2011, $1,060 million relates to securities
issued by government-sponsored entities and $1,549 million relates to securities of private label issuers. Securities issued by private label issuers are collateralized
primarily by pools of individual direct mortgage loans of financial institutions.
The fair value of investment securities increased to $47,374 million at December 31, 2011, from $43,938 million at December 31, 2010,
primarily due to the impact of lower interest rates and funding in our CLL business of investments collateralized by senior secured loans
of high-quality, middle-market companies in a variety of industries.
The following tables present the estimated fair values and gross unrealized losses of our available-for-sale investment securities.
2011 2010
In loss position for
Less than 12 months 12 months or more Less than 12 months 12 months or more
December 31 (In millions)
Estimated
fair value
Gross
unrealized
losses (a) Estimated
fair value
Gross
unrealized
losses (a) Estimated
fair value
Gross
unrealized
losses
Estimated
fair value
Gross
unrealized
losses
Debt
U.S. corporate $1,435 $(241) $ 836 $ (169) $2,375 $ (81) $1,519 $ (156)
State and municipal 87 (1) 307 (142) 949 (43) 570 (239)
Residential mortgage-backed 219 (9) 825 (277) 188 (4) 1,024 (374)
Commercial mortgage-backed 244 (23) 1,320 (224) 831 (104) 817 (126)
Asset-backed 100 (7) 850 (157) 113 (5) 910 (188)
Corporate—non-U.S. 330 (28) 607 (179) 448 (12) 804 (120)
Government—non-U.S. 906 (5) 203 (81) 661 (6) 107 (52)
U.S. government and federal agency 502———1,822 (47) — —
Retained interests ————— — 34 (26)
Equity 440 (38) — — 49 (8) — —
Total $4,263 $(352) $4,948 $(1,229) $7,436 $(310) $5,785 $(1,281)
(a) Includes gross unrealized losses at December 31, 2011 of $(272) million related to securities that had other-than-temporary impairments recognized in a prior period.