GE 2011 Annual Report Download - page 76
Download and view the complete annual report
Please find page 76 of the 2011 GE annual report below. You can navigate through the pages in the report by either clicking on the pages listed below, or by using the keyword search tool below to find specific information within the annual report.-
 1
1 -
2
-
3
-
4
-
5
-
6
-
7
-
8
-
9
-
10
-
11
-
12
-
13
-
14
-
15
-
16
-
17
-
18
-
19
-
20
-
21
-
22
-
23
-
24
-
25
-
26
-
27
-
28
-
29
-
30
-
31
-
32
-
33
-
34
-
35
-
36
-
37
-
38
-
39
-
40
-
41
-
42
-
43
-
44
-
45
-
46
-
47
-
48
-
49
-
50
-
51
-
52
-
53
-
54
-
55
-
56
-
57
-
58
-
59
-
60
-
61
-
62
-
63
-
64
-
65
-
 66
66 -
 67
67 -
 68
68 -
 69
69 -
 70
70 -
 71
71 -
 72
72 -
 73
73 -
 74
74 -
 75
75 -
 76
76 -
 77
77 -
 78
78 -
 79
79 -
 80
80 -
 81
81 -
 82
82 -
 83
83 -
 84
84 -
 85
85 -
 86
86 -
87
-
88
-
89
-
90
-
91
-
92
-
93
-
94
-
95
-
96
-
97
-
98
-
99
-
100
-
101
-
102
-
103
-
104
-
105
-
106
-
107
-
108
-
109
-
110
-
111
-
112
-
113
-
114
-
115
-
116
-
117
-
118
-
119
-
120
-
121
-
122
-
123
-
124
-
125
-
126
-
127
-
128
-
129
-
130
-
131
-
132
-
133
-
134
-
135
-
136
-
137
-
138
-
139
-
140
-
141
-
142
-
143
-
144
-
145
-
146
 |
 |

74 GE 2011 ANNUAL REPORT
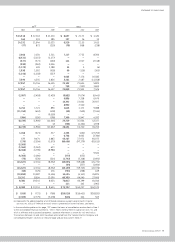
Statement of Cash Flows
General Electric Company
and consolidated affiliates
For the years ended December 31 (In millions) 2011 2010 2009
CASH FLOWS—OPERATING ACTIVITIES
Net earnings $ 14,443 $ 12,179 $ 11,225
Less net earnings attributable to noncontrolling interests 292 535 200
Net earnings attributable to the Company 14,151 11,644 11,025
(Earnings) loss from discontinued operations (77) 873 (219)
Adjustments to reconcile net earnings attributable to the
Company to cash provided from operating activities
Depreciation and amortization of property, plant and equipment 9,185 9,786 10,617
Earnings from continuing operations retained by GECS ———
Deferred income taxes (203) 930 (2,778)
Decrease (increase) in GE current receivables (466) (126) 3,273
Decrease (increase) in inventories (1,168) 342 1,101
Increase (decrease) in accounts payable 1,235 883 (464)
Increase (decrease) in GE progress collections (1,394) (1,177) (500)
Provision for losses on GECS financing receivables 4,083 7,176 10,585
All other operating activities 7,255 5,925 (9,828)
Cash from (used for) operating activities—continuing operations 32,601 36,256 22,812
Cash from (used for) operating activities—discontinued operations 758 (132) 1,605
CASH FROM (USED FOR) OPERATING ACTIVITIES 33,359 36,124 24,417
CASH FLOWS—INVESTING ACTIVITIES
Additions to property, plant and equipment (12,650) (9,800) (8,636)
Dispositions of property, plant and equipment 5,896 7,208 6,479
Net decrease (increase) in GECS financing receivables 14,652 21,773 36,665
Proceeds from sales of discontinued operations 8,950 2,510 —
Proceeds from principal business dispositions 8,877 3,062 9,978
Payments for principal businesses purchased (11,202) (1,212) (7,842)
Capital contribution from GE to GECS ———
All other investing activities 6,094 10,249 3,758
Cash from (used for) investing activities—continuing operations 20,617 33,790 40,402
Cash from (used for) investing activities—discontinued operations (735) (1,354) 1,976
CASH FROM (USED FOR) INVESTING ACTIVITIES 19,882 32,436 42,378
CASH FLOWS—FINANCING ACTIVITIES
Net increase (decrease) in borrowings (maturities of 90 days or less) 5,951 (1,228) (26,114)
Net increase (decrease) in bank deposits 6,748 4,603 (3,784)
Newly issued debt (maturities longer than 90 days) 43,847 47,643 82,846
Repayments and other reductions (maturities longer than 90 days) (85,706) (99,933) (83,290)
Repayment of preferred stock (3,300) ——
Net dispositions (purchases) of GE shares for treasury (1,456) (1,263) 623
Dividends paid to shareowners (6,458) (4,790) (8,986)
Capital contribution from GE to GECS ———
Purchases of subsidiary shares from noncontrolling interests (4,578) (2,633) —
All other financing activities (1,867) (3,648) (3,204)
Cash from (used for) financing activities—continuing operations (46,819) (61,249) (41,909)
Cash from (used for) financing activities—discontinued operations (44) (337) (1,604)
CASH FROM (USED FOR) FINANCING ACTIVITIES (46,863) (61,586) (43,513)
Effect of exchange rate changes on cash and equivalents (841) (333) 795
Increase (decrease) in cash and equivalents 5,537 6,641 24,077
Cash and equivalents at beginning of year 79,085 72,444 48,367
Cash and equivalents at end of year 84,622 79,085 72,444
Less cash and equivalents of discontinued operations at end of year 121 142 1,965
Cash and equivalents of continuing operations at end of year $ 84,501 $ 78,943 $ 70,479
SUPPLEMENTAL DISCLOSURE OF CASH FLOWS INFORMATION
Cash paid during the year for interest $(15,571) $(17,132) $(19,601)
Cash recovered (paid) during the year for income taxes (2,919) (2,671) (2,535)
See accompanying notes.