GE 2011 Annual Report Download - page 74
Download and view the complete annual report
Please find page 74 of the 2011 GE annual report below. You can navigate through the pages in the report by either clicking on the pages listed below, or by using the keyword search tool below to find specific information within the annual report.-
 1
1 -
2
-
3
-
4
-
5
-
6
-
7
-
8
-
9
-
10
-
11
-
12
-
13
-
14
-
15
-
16
-
17
-
18
-
19
-
20
-
21
-
22
-
23
-
24
-
25
-
26
-
27
-
28
-
29
-
30
-
31
-
32
-
33
-
34
-
35
-
36
-
37
-
38
-
39
-
40
-
41
-
42
-
43
-
44
-
45
-
46
-
47
-
48
-
49
-
50
-
51
-
52
-
53
-
54
-
55
-
56
-
57
-
58
-
59
-
60
-
61
-
62
-
63
-
 64
64 -
 65
65 -
 66
66 -
 67
67 -
 68
68 -
 69
69 -
 70
70 -
 71
71 -
 72
72 -
 73
73 -
 74
74 -
 75
75 -
 76
76 -
 77
77 -
 78
78 -
 79
79 -
 80
80 -
 81
81 -
 82
82 -
 83
83 -
 84
84 -
85
-
86
-
87
-
88
-
89
-
90
-
91
-
92
-
93
-
94
-
95
-
96
-
97
-
98
-
99
-
100
-
101
-
102
-
103
-
104
-
105
-
106
-
107
-
108
-
109
-
110
-
111
-
112
-
113
-
114
-
115
-
116
-
117
-
118
-
119
-
120
-
121
-
122
-
123
-
124
-
125
-
126
-
127
-
128
-
129
-
130
-
131
-
132
-
133
-
134
-
135
-
136
-
137
-
138
-
139
-
140
-
141
-
142
-
143
-
144
-
145
-
146
 |
 |

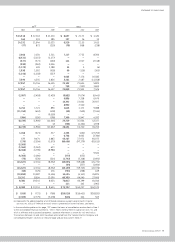
72 GE 2011 ANNUAL REPORT
Statement of Financial Position
General Electric Company
and consolidated affiliates
At December 31 (In millions, except share amounts) 2011 2010
ASSETS
Cash and equivalents $ 84,501 $ 78,943
Investment securities (Note 3) 47,374 43,938
Current receivables (Note 4) 19,531 18,621
Inventories (Note 5) 13,792 11,526
Financing receivables—net (Notes 6 and 23) 280,378 303,012
Other GECS receivables 7,561 7,571
Property, plant and equipment—net (Note 7) 65,739 66,212
Investment in GECS ——
Goodwill (Note 8) 72,625 64,388
Other intangible assets—net (Note 8) 12,068 9,971
All other assets (Note 9) 111,707 94,299
Assets of businesses held for sale (Note 2) 711 36,887
Assets of discontinued operations (Note 2) 1,255 12,425
Total assets (a) $717,242 $747,793
LIABILITIES AND EQUITY
Short-term borrowings (Note 10) $137,611 $117,959
Accounts payable, principally trade accounts 16,400 14,656
Progress collections and price adjustments accrued 10,402 11,142
Dividends payable 1,797 1,563
Other GE current liabilities 14,796 11,396
Non-recourse borrowings of consolidated securitization entities (Note 10) 29,258 30,018
Bank deposits (Note 10) 43,115 37,298
Long-term borrowings (Note 10) 243,459 293,323
Investment contracts, insurance liabilities and insurance annuity benefits (Note 11) 29,774 29,582
All other liabilities (Note 13) 70,647 55,271
Deferred income taxes (Note 14) (131) 2,753
Liabilities of businesses held for sale (Note 2) 345 16,047
Liabilities of discontinued operations (Note 2) 1,635 2,587
Total liabilities (a) 599,108 623,595
Preferred stock (0 and 30,000 shares outstanding at year-end 2011 and 2010, respectively) ——
Common stock (10,573,017,000 and 10,615,376,000 shares outstanding at year-end 2011 and 2010, respectively) 702 702
Accumulated other comprehensive income—net (b)
Investment securities (30) (636)
Currency translation adjustments 133 (86)
Cash flow hedges (1,176) (1,280)
Benefit plans (22,901) (15,853)
Other capital 33,693 36,890
Retained earnings 137,786 131,137
Less common stock held in treasury (31,769) (31,938)
Total GE shareowners’ equity 116,438 118,936
Noncontrolling interests (c) 1,696 5,262
Total equity (Notes 15 and 16) 118,134 124,198
Total liabilities and equity $717,242 $747,793
(a) Our consolidated assets at December 31, 2011 include total assets of $45,514 million of certain variable interest entities (VIEs) that can only be used to settle the liabilities
of those VIEs. These assets include net financing receivables of $37,120 million and investment securities of $5,320 million. Our consolidated liabilities at December 31, 2011
include liabilities of certain VIEs for which the VIE creditors do not have recourse to GE. These liabilities include non-recourse borrowings of consolidated securitization
entities (CSEs) of $28,758 million. See Note 24.
(b) The sum of accumulated other comprehensive income—net was $(23,974) million and $(17,855) million at December 31, 2011 and 2010, respectively.
(c) Included accumulated other comprehensive income—net attributable to noncontrolling interests of $(168) million and $(153) million at December 31, 2011 and
2010, respectively.
See accompanying notes.