GE 2011 Annual Report Download - page 72
Download and view the complete annual report
Please find page 72 of the 2011 GE annual report below. You can navigate through the pages in the report by either clicking on the pages listed below, or by using the keyword search tool below to find specific information within the annual report.-
 1
1 -
2
-
3
-
4
-
5
-
6
-
7
-
8
-
9
-
10
-
11
-
12
-
13
-
14
-
15
-
16
-
17
-
18
-
19
-
20
-
21
-
22
-
23
-
24
-
25
-
26
-
27
-
28
-
29
-
30
-
31
-
32
-
33
-
34
-
35
-
36
-
37
-
38
-
39
-
40
-
41
-
42
-
43
-
44
-
45
-
46
-
47
-
48
-
49
-
50
-
51
-
52
-
53
-
54
-
55
-
56
-
57
-
58
-
59
-
60
-
61
-
 62
62 -
 63
63 -
 64
64 -
 65
65 -
 66
66 -
 67
67 -
 68
68 -
 69
69 -
 70
70 -
 71
71 -
 72
72 -
 73
73 -
 74
74 -
 75
75 -
 76
76 -
 77
77 -
 78
78 -
 79
79 -
 80
80 -
 81
81 -
 82
82 -
83
-
84
-
85
-
86
-
87
-
88
-
89
-
90
-
91
-
92
-
93
-
94
-
95
-
96
-
97
-
98
-
99
-
100
-
101
-
102
-
103
-
104
-
105
-
106
-
107
-
108
-
109
-
110
-
111
-
112
-
113
-
114
-
115
-
116
-
117
-
118
-
119
-
120
-
121
-
122
-
123
-
124
-
125
-
126
-
127
-
128
-
129
-
130
-
131
-
132
-
133
-
134
-
135
-
136
-
137
-
138
-
139
-
140
-
141
-
142
-
143
-
144
-
145
-
146
 |
 |

70 GE 2011 ANNUAL REPORT
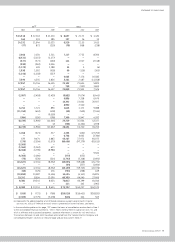
Statement of Earnings
General Electric Company
and consolidated affiliates
For the years ended December 31 (In millions; per-share amounts in dollars) 2011 2010 2009
REVENUES
Sales of goods $ 66,875 $ 60,812 $ 65,067
Sales of services 27,648 39,625 38,710
Other income (Note 17) 5,063 1,151 1,006
GECS earnings from continuing operations ———
GECS revenues from services (Note 18) 47,714 48,005 49,655
Total revenues 147,300 149,593 154,438
COSTS AND EXPENSES (Note 19)
Cost of goods sold 51,455 46,005 50,580
Cost of services sold 16,823 25,708 25,341
Interest and other financial charges 14,545 15,553 17,697
Investment contracts, insurance losses and insurance annuity benefits 2,912 3,012 3,017
Provision for losses on financing receivables (Notes 6 and 23) 4,083 7,176 10,585
Other costs and expenses 37,384 38,054 37,354
Total costs and expenses 127,202 135,508 144,574
EARNINGS (LOSS) FROM CONTINUING OPERATIONS BEFORE INCOME TAXES 20,098 14,085 9,864
Benefit (provision) for income taxes (Note 14) (5,732) (1,033) 1,142
EARNINGS FROM CONTINUING OPERATIONS 14,366 13,052 11,006
Earnings (loss) from discontinued operations, net of taxes (Note 2) 77 (873) 219
NET EARNINGS 14,443 12,179 11,225
Less net earnings attributable to noncontrolling interests 292 535 200
NET EARNINGS ATTRIBUTABLE TO THE COMPANY 14,151 11,644 11,025
Preferred stock dividends declared (1,031) (300) (300)
NET EARNINGS ATTRIBUTABLE TO GE COMMON SHAREOWNERS $ 13,120 $ 11,344 $ 10,725
AMOUNTS ATTRIBUTABLE TO THE COMPANY
Earnings from continuing operations $ 14,074 $ 12,517 $ 10,806
Earnings (loss) from discontinued operations, net of taxes 77 (873) 219
NET EARNINGS ATTRIBUTABLE TO THE COMPANY $ 14,151 $ 11,644 $ 11,025
PER-SHARE AMOUNTS (Note 20)
Earnings from continuing operations
Diluted earnings per share $ 1.23 $ 1.14 $ 0.99
Basic earnings per share 1.23 1.14 0.99
Net earnings
Diluted earnings per share 1.23 1.06 1.01
Basic earnings per share 1.24 1.06 1.01
DIVIDENDS DECLARED PER SHARE 0.61 0.46 0.61
See Note 3 for other-than-temporary impairment amounts.
See accompanying notes.
Consolidated Statement of Changes in Shareowners’ Equity
(In millions) 2011 2010 2009
CHANGES IN SHAREOWNERS’ EQUITY (Note 15)
GE shareowners’ equity balance at January 1 $118,936 $117,291 $104,665
Dividends and other transactions with shareowners (10,530) (5,701) (5,049)
Other comprehensive income (loss)
Investment securities—net 606 16 2,659
Currency translation adjustments—net 219 (3,874) 4,135
Cash flow hedges—net 104 454 1,598
Benefit plans—net (7,048) 1,079 (1,804)
Total other comprehensive income (loss) (6,119) (2,325) 6,588
Increases from net earnings attributable to the Company 14,151 11,644 11,025
Comprehensive income (loss) 8,032 9,319 17,613
Cumulative effect of changes in accounting principles (a) —(1,973) 62
Balance at December 31 116,438 118,936 117,291
Noncontrolling interests (b) 1,696 5,262 7,845
Total equity balance at December 31 $118,134 $124,198 $125,136
(a) On January 1, 2010, we adopted amendments to Accounting Standards Codification (ASC) 860, Transfers and Servicing and ASC 810, Consolidation, and recorded a
cumulative effect adjustment. See Notes 15 and 24. We adopted amendments to ASC 320, Investments—Debt and Equity Securities, and recorded a cumulative effect
adjustment to increase retained earnings as of April 1, 2009. See Notes 3 and 15.
(b) See Note 15 for further information about the changes in noncontrolling interests.
See accompanying notes.