GE 2013 Annual Report Download - page 100
Download and view the complete annual report
Please find page 100 of the 2013 GE annual report below. You can navigate through the pages in the report by either clicking on the pages listed below, or by using the keyword search tool below to find specific information within the annual report.-
 1
1 -
2
-
3
-
4
-
5
-
6
-
7
-
8
-
9
-
10
-
11
-
12
-
13
-
14
-
15
-
16
-
17
-
18
-
19
-
20
-
21
-
22
-
23
-
24
-
25
-
26
-
27
-
28
-
29
-
30
-
31
-
32
-
33
-
34
-
35
-
36
-
37
-
38
-
39
-
40
-
41
-
42
-
43
-
44
-
45
-
46
-
47
-
48
-
49
-
50
-
51
-
52
-
53
-
54
-
55
-
56
-
57
-
58
-
59
-
60
-
61
-
62
-
63
-
64
-
65
-
66
-
67
-
68
-
69
-
70
-
71
-
72
-
73
-
74
-
75
-
76
-
77
-
78
-
79
-
80
-
81
-
82
-
83
-
84
-
85
-
86
-
87
-
88
-
89
-
 90
90 -
 91
91 -
 92
92 -
 93
93 -
 94
94 -
 95
95 -
 96
96 -
 97
97 -
 98
98 -
 99
99 -
 100
100 -
 101
101 -
 102
102 -
 103
103 -
 104
104 -
 105
105 -
 106
106 -
 107
107 -
 108
108 -
 109
109 -
 110
110 -
111
-
112
-
113
-
114
-
115
-
116
-
117
-
118
-
119
-
120
-
121
-
122
-
123
-
124
-
125
-
126
-
127
-
128
-
129
-
130
-
131
-
132
-
133
-
134
-
135
-
136
-
137
-
138
-
139
-
140
-
141
-
142
-
143
-
144
-
145
-
146
-
147
-
148
-
149
-
150
 |
 |

98 GE 2013 ANNUAL REPORT
Supplemental Credit Quality Information
COMMERCIAL
Substantially all of our Commercial fi nancing receivables port-
folio is secured lending and we assess the overall quality of the
portfolio based on the potential risk of loss measure. The metric
incorporates both the borrower’s credit quality along with any
related collateral protection.
Our internal risk ratings process is an important source of
information in determining our allowance for losses and rep-
resents a comprehensive, statistically validated approach to
evaluate risk in our fi nancing receivables portfolios. In deriving
our internal risk ratings, we stratify our Commercial portfolios
into 21 categories of default risk and/or six categories of loss
given default to group into three categories: A, B and C. Our pro-
cess starts by developing internal risk ratings for our borrowers,
which are based upon our proprietary models using data derived
from borrower fi nancial statements, agency ratings, payment his-
tory information, equity prices and other commercial borrower
characteristics. We then evaluate the potential risk of loss for
the specifi c lending transaction in the event of borrower default,
which takes into account such factors as applicable collateral
value, historical loss and recovery rates for similar transactions,
and our collection capabilities. Our internal risk ratings process
and the models we use are subject to regular monitoring and
validation controls. The frequency of rating updates is set by our
credit risk policy, which requires annual Risk Committee approval.
The models are updated on a regular basis and statistically vali-
dated annually, or more frequently as circumstances warrant.
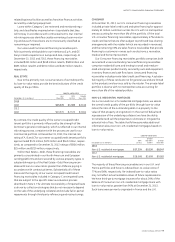
The table below summarizes our Commercial fi nancing receiv-
ables by risk category. As described above, fi nancing receivables are
assigned one of 21 risk ratings based on our process and then
these are grouped by similar characteristics into three catego-
ries in the table below. Category A is characterized by either
high-credit-quality borrowers or transactions with signifi cant
collateral coverage that substantially reduces or eliminates the
risk of loss in the event of borrower default. Category B is char-
acterized by borrowers with weaker credit quality than those in
Category A, or transactions with moderately strong collateral
coverage that minimizes but may not fully mitigate the risk of
loss in the event of default. Category C is characterized by bor-
rowers with higher levels of default risk relative to our overall
portfolio or transactions where collateral coverage may not
fully mitigate a loss in the event of default.
Secured
December 31 (In millions) ABCTotal
2013
CLL
Americas $ 65,444 $ 1,587 $ 1,554 $ 68,585
Europe (a) 35,968 479 1,019 37,466
Asia 8,962 140 218 9,320
Other (a) 101 — — 101
Total CLL 110,475 2,206 2,791 115,472
Energy Financial Services 2,969 9 — 2,978
GECAS 9,175 50 152 9,377
Other 318 — — 318
Total $ 122,937 $ 2,265 $ 2,943 $ 128,145
2012
CLL
Americas $ 68,360 $ 1,775 $ 2,382 $ 72,517
Europe (a) 33,756 1,188 1,256 36,200
Asia 10,732 117 372 11,221
Other (a) 159 — 94 253
Total CLL 113,007 3,080 4,104 120,191
Energy Financial Services 4,725 — — 4,725
GECAS 10,681 223 11 10,915
Other 486 — — 486
Total $ 128,899 $ 3,303 $ 4,115 $ 136,317
(a) During 2013, we transferred our European equipment services portfolio from CLL Other to CLL Europe. Prior-period amounts were reclassified to conform to the current
period presentation.
For our secured fi nancing receivables portfolio, our collateral
position and ability to work out problem accounts mitigates our
losses. Our asset managers have deep industry expertise that
enables us to identify the optimum approach to default situa-
tions. We price risk premiums for weaker credits at origination,
closely monitor changes in creditworthiness through our risk
ratings and watch list process, and are engaged early with dete-
riorating credits to minimize economic loss. Secured fi nancing
receivables within risk Category C are predominantly in our CLL
businesses and are primarily composed of senior term lending
facilities and factoring programs secured by various asset types
including inventory, accounts receivable, cash, equipment and