GE 2013 Annual Report Download - page 11
Download and view the complete annual report
Please find page 11 of the 2013 GE annual report below. You can navigate through the pages in the report by either clicking on the pages listed below, or by using the keyword search tool below to find specific information within the annual report.-
 1
1 -
 2
2 -
 3
3 -
 4
4 -
 5
5 -
 6
6 -
 7
7 -
 8
8 -
 9
9 -
 10
10 -
 11
11 -
 12
12 -
 13
13 -
 14
14 -
 15
15 -
 16
16 -
 17
17 -
 18
18 -
 19
19 -
 20
20 -
 21
21 -
 22
22 -
23
-
24
-
25
-
26
-
27
-
28
-
29
-
30
-
31
-
32
-
33
-
34
-
35
-
36
-
37
-
38
-
39
-
40
-
41
-
42
-
43
-
44
-
45
-
46
-
47
-
48
-
49
-
50
-
51
-
52
-
53
-
54
-
55
-
56
-
57
-
58
-
59
-
60
-
61
-
62
-
63
-
64
-
65
-
66
-
67
-
68
-
69
-
70
-
71
-
72
-
73
-
74
-
75
-
76
-
77
-
78
-
79
-
80
-
81
-
82
-
83
-
84
-
85
-
86
-
87
-
88
-
89
-
90
-
91
-
92
-
93
-
94
-
95
-
96
-
97
-
98
-
99
-
100
-
101
-
102
-
103
-
104
-
105
-
106
-
107
-
108
-
109
-
110
-
111
-
112
-
113
-
114
-
115
-
116
-
117
-
118
-
119
-
120
-
121
-
122
-
123
-
124
-
125
-
126
-
127
-
128
-
129
-
130
-
131
-
132
-
133
-
134
-
135
-
136
-
137
-
138
-
139
-
140
-
141
-
142
-
143
-
144
-
145
-
146
-
147
-
148
-
149
-
150
 |
 |

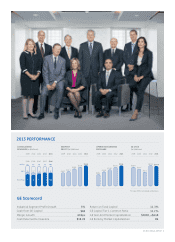
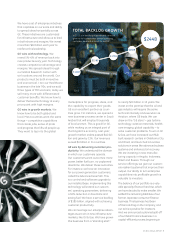
Our industrial segment earnings grew
5%. Performance was broad-based
with four businesses growing earnings
10% or more: Aviation, Oil & Gas,
Transportation and Appliances &
Lighting. We ended the year with
$244 billion in backlog, a record.
GE Capital grew its earnings by 12%,
behind strong performance in Real
Estate and international lending and
leasing. We continued to shrink our
balance sheet; ending net investment
was $380 billion at year-end, down
more than 40% from our pre-crisis
peak. With a shrinking balance sheet
and massive fi nancial strength,
GE Capital was able to pay a $6 billion
dividend to the parent.
Our total shareholder return expanded
by 38% in 2013, ahead of the market.
We added $64 billion of market cap
and, at $282 billion, are the sixth most
valuable company in the world. At
year-end, we increased our dividend
by 16%.
In 2014, we have planned for our
industrial earnings to grow by more
than 10%. We expect organic revenue
growth between 4%–7%. The big
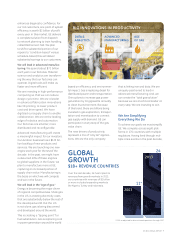
initiatives will fuel our success. Growth
market orders expanded by 11%
in 2013; this will translate into solid
revenue growth. Our service revenue
is $45 billion, and we expect solid rev-
enue growth in 2014. We are planning
for another year of substantial margin
enhancement, beyond the 15.7% we
achieved in 2013.
Margins have been an area of focus
for GE. A decade ago, during the
power bubble, we had artifi cially high
margins. This has now been reset, and
we have been making steady prog-
ress. Through simplifi cation, we have
made substantial reductions in struc-
tural cost. FastWorks is focused on
equipment margins, which will be up
substantially this year. We are restruc-
turing our lower-margin businesses
with a target of at least 10% margins
for them in the near term.
GE Capital’s earnings will decline in
2014 and 2015 as we exit Retail
Finance. However, we plan to grow
move commercial decisions closer to
the customer. In our Aviation services
business, 75% of the fl ow commercial
deals are approved in the regions
with quick turnaround. Our Company
is beginning to feel the market speed.
In a digital world, the major source of
scale advantage derives from a lean
backroom structure with a foundation
of information. GE will be a major ben-
efi ciary of cloud computing, simplifi ed
systems and mobility.
We will still make a few mistakes. But
the biggest risks at GE are the inabil-
ity to seize market opportunities,
layers that block reality and leaders
who are not personally account-
able. Simplifi cation is making us
more competitive.
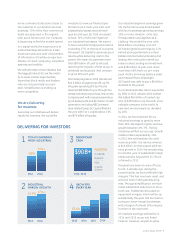
We Are Delivering
for Investors
Executing our initiatives will deliver
results for investors. We would like
investors to view our fi nancial per-
formance as a multi-year plan with
substantial progress reached each
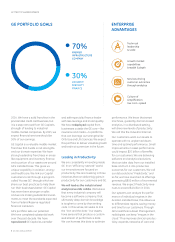
quarter and year. By 2016, we expect
to have 70% of GE’s earnings from
our industrial businesses. We expect
to have industrial margins and returns
exceeding 17%, at the top of our peers.
We expect GE Capital to generate good
returns while delivering cash to the
parent. We expect to generate more
than $90 billion of cash to allocate,
returning the majority of that to you in
dividends and buyback. And, we plan
to grow EPS each year.
We made progress in 2013. We earned
$24.5 billion of segment profi t, up 7%.
We grew operating EPS by 9% and
returned $18 billion to you through divi-
dends and share repurchase. We ran the
Company well, with margins expanding
by 60 basis points and $17 billion of cash
generation, excluding NBCUniversal
deal-related taxes. GE Capital fi nished
the year with Tier 1 capital above 11%
and $75 billion of liquidity.
DELIVERING FOR INVESTORS
SIGNIFICANT
CASH
INDUSTRIAL
MARGIN GROWTH GROW EPS
EVERY YEAR
70% OF EARNINGS
FROM INDUSTRIAL
1 3
4
2
15.7%
$1.64
~55%
70%+
17%+
2013 2016
2014–201620162013
20142013 2015 2016
FUNDING:
Dividends
Buyback
M&A
Organic
Growth
$90B+
GE 2013 ANNUAL REPORT 9