GE 2013 Annual Report Download - page 105
Download and view the complete annual report
Please find page 105 of the 2013 GE annual report below. You can navigate through the pages in the report by either clicking on the pages listed below, or by using the keyword search tool below to find specific information within the annual report.-
 1
1 -
2
-
3
-
4
-
5
-
6
-
7
-
8
-
9
-
10
-
11
-
12
-
13
-
14
-
15
-
16
-
17
-
18
-
19
-
20
-
21
-
22
-
23
-
24
-
25
-
26
-
27
-
28
-
29
-
30
-
31
-
32
-
33
-
34
-
35
-
36
-
37
-
38
-
39
-
40
-
41
-
42
-
43
-
44
-
45
-
46
-
47
-
48
-
49
-
50
-
51
-
52
-
53
-
54
-
55
-
56
-
57
-
58
-
59
-
60
-
61
-
62
-
63
-
64
-
65
-
66
-
67
-
68
-
69
-
70
-
71
-
72
-
73
-
74
-
75
-
76
-
77
-
78
-
79
-
80
-
81
-
82
-
83
-
84
-
85
-
86
-
87
-
88
-
89
-
90
-
91
-
92
-
93
-
94
-
 95
95 -
 96
96 -
 97
97 -
 98
98 -
 99
99 -
 100
100 -
 101
101 -
 102
102 -
 103
103 -
 104
104 -
 105
105 -
 106
106 -
 107
107 -
 108
108 -
 109
109 -
 110
110 -
 111
111 -
 112
112 -
 113
113 -
 114
114 -
 115
115 -
116
-
117
-
118
-
119
-
120
-
121
-
122
-
123
-
124
-
125
-
126
-
127
-
128
-
129
-
130
-
131
-
132
-
133
-
134
-
135
-
136
-
137
-
138
-
139
-
140
-
141
-
142
-
143
-
144
-
145
-
146
-
147
-
148
-
149
-
150
 |
 |

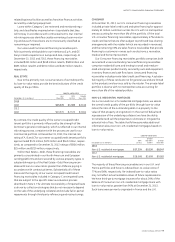
GE 2013 ANNUAL REPORT 103
INTANGIBLE ASSETS SUBJECT TO AMORTIZATION
December 31 (In millions)
Gross
carrying
amount
Accumulated
amortization Net
2013
Customer-related $ 7,938 $ (2,312) $ 5,626
Patents and technology 6,602 (2,621) 3,981
Capitalized software 8,256 (5,252) 3,004
Trademarks 1,356 (295) 1,061
Lease valuations 703 (498) 205
Present value of future
profits (a) 574 (574) —
All other 632 (359) 273
Total $ 26,061 $ (11,911) $ 14,150
2012
Customer-related $ 6,977 $ (2,156) $ 4,821
Patents and technology 5,432 (2,406) 3,026
Capitalized software 7,514 (4,673) 2,841
Trademarks 995 (239) 756
Lease valuations 1,163 (792) 371
Present value of future
profits (a) 530 (530) —
All other 375 (369) 6
Total $ 22,986 $ (11,165) $ 11,821
(a) Balances at December 31, 2013 and 2012 reflect adjustments of $322 million and
$353 million, respectively, to the present value of future profits in our run-off
insurance operations to reflect the effects that would have been recognized had
the related unrealized investment securities holding gains and losses actually
been realized.
During 2013, we recorded additions to intangible assets subject
to amortization of $3,735 million, primarily from the acquisitions
of Avio ($1,830 million) and Lufkin ($997 million) as well as the cap-
italization of new software across several business platforms. The
components of fi nite-lived intangible assets acquired during 2013
and their respective weighted-average amortizable period are:
$1,257 million—Customer-related (21.9 years); $1,255 million—
Patents and technology (25.5 years); $732 million—Capitalized
software (4.6 years); $363 million—Trademarks (28.1 years); $2 mil-
lion—Lease valuations (5.0 years); and $126 million—All other
(22.4 years).
Consolidated amortization related to intangible assets was
$1,711 million, $1,612 million and $1,744 million for 2013, 2012
and 2011, respectively. We estimate annual pre-tax amortiza-
tion for intangible assets over the next fi ve calendar years to be
as follows: 2014—$1,588 million; 2015—$1,473 million; 2016—
$1,336 million; 2017—$1,185 million; and 2018—$1,026 million.
Note 9.
All Other Assets
December 31 (In millions) 2013 2012
GE
Investments
Associated companies (a) $ 3,937 $ 22,169
Other 626 445
4,563 22,614
Contract costs and estimated earnings (b) 12,522 11,041
Long-term receivables, including notes 993 714
Derivative instruments 623 383
Other 5,007 4,782
23,708 39,534
GECC
Investments
Associated companies 17,348 19,119
Real estate (c) (d) 16,163 25,154
Assets held for sale (e) 2,571 4,194
Cost method (d) 1,462 1,665
Other 930 1,446
38,474 51,578
Advances to suppliers 2,328 1,805
Derivative instruments 1,117 3,557
Deferred borrowing costs 867 940
Deferred acquisition costs (f) 29 46
Other 4,551 4,260
47,366 62,186
ELIMINATIONS (266) (76)
Total $ 70,808 $ 101,644
(a) Included our investment in NBCU LLC of $18,887 million at December 31, 2012. At
December 31, 2012, we also had $4,937 million of deferred tax liabilities related
to this investment. See Note 14.
(b) Contract costs and estimated earnings reflect revenues earned in excess of
billings on our long-term contracts to construct technically complex equipment
(such as power generation, aircraft engines and aeroderivative units) and
long-term product maintenance or extended warranty arrangements. These
amounts are presented net of related billings in excess of revenues of
$1,842 million and $1,498 million at December 31, 2013 and 2012, respectively.
(c) GECC investments in real estate consisted principally of two categories: real
estate held for investment and equity method investments. Both categories
contained a wide range of properties including the following at December 31,
2013: office buildings (52%), apartment buildings (14%), retail facilities (9%),
industrial properties (7%), franchise properties (3%) and other (15%). At
December 31, 2013, investments were located in the Americas (41%), Europe
(35%) and Asia (24%).
(d) The fair value of and unrealized loss on cost method investments in a continuous
loss position for less than 12 months at December 31, 2013, were $17 million and
an insignificant amount, respectively. There were no cost method investments in
a continuous loss position for 12 months or more at December 31, 2013. The fair
value of and unrealized loss on cost method investments in a continuous loss
position for less than 12 months at December 31, 2012, were $142 million and
$37 million, respectively. The fair value of and unrealized loss on cost method
investments in a continuous loss position for 12 months or more at December
31, 2012, were $2 million and an insignificant amount, respectively.
(e) Assets were classified as held for sale on the date a decision was made to
dispose of them through sale or other means. At December 31, 2013 and 2012,
such assets consisted primarily of loans, aircraft, equipment and real estate
properties, and were accounted for at the lower of carrying amount or estimated
fair value less costs to sell. These amounts are net of valuation allowances of
$127 million and $200 million at December 31, 2013 and 2012, respectively.
(f) Balances at December 31, 2013 and 2012 reflect adjustments of $700 million and
$764 million, respectively, to deferred acquisition costs in our run-off insurance
operations to reflect the effects that would have been recognized had the
related unrealized investment securities holding gains and losses actually
been realized.