GE 2013 Annual Report Download - page 143
Download and view the complete annual report
Please find page 143 of the 2013 GE annual report below. You can navigate through the pages in the report by either clicking on the pages listed below, or by using the keyword search tool below to find specific information within the annual report.-
 1
1 -
2
-
3
-
4
-
5
-
6
-
7
-
8
-
9
-
10
-
11
-
12
-
13
-
14
-
15
-
16
-
17
-
18
-
19
-
20
-
21
-
22
-
23
-
24
-
25
-
26
-
27
-
28
-
29
-
30
-
31
-
32
-
33
-
34
-
35
-
36
-
37
-
38
-
39
-
40
-
41
-
42
-
43
-
44
-
45
-
46
-
47
-
48
-
49
-
50
-
51
-
52
-
53
-
54
-
55
-
56
-
57
-
58
-
59
-
60
-
61
-
62
-
63
-
64
-
65
-
66
-
67
-
68
-
69
-
70
-
71
-
72
-
73
-
74
-
75
-
76
-
77
-
78
-
79
-
80
-
81
-
82
-
83
-
84
-
85
-
86
-
87
-
88
-
89
-
90
-
91
-
92
-
93
-
94
-
95
-
96
-
97
-
98
-
99
-
100
-
101
-
102
-
103
-
104
-
105
-
106
-
107
-
108
-
109
-
110
-
111
-
112
-
113
-
114
-
115
-
116
-
117
-
118
-
119
-
120
-
121
-
122
-
123
-
124
-
125
-
126
-
127
-
128
-
129
-
130
-
131
-
132
-
 133
133 -
 134
134 -
 135
135 -
 136
136 -
 137
137 -
 138
138 -
 139
139 -
 140
140 -
 141
141 -
 142
142 -
 143
143 -
 144
144 -
 145
145 -
 146
146 -
 147
147 -
 148
148 -
 149
149 -
 150
150
 |
 |

GE 2013 ANNUAL REPORT 141
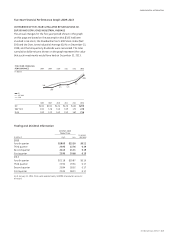
Average GE Shareowners’ Equity, Excluding Effects of Discontinued Operations (a)
December 31 (In millions) 2013 2012 2011 2010 2009
Average GE shareowners’ equity (b) $ 124,501 $ 120,411 $ 122,289 $ 116,179 $ 110,535
Less the effects of the average net investment in
discontinued operations (167) (478) 4,924 13,819 17,432
Average GE shareowners’ equity, excluding effects of
discontinued operations (a) $ 124,668 $ 120,889 $ 117,365 $ 102,360 $ 93,103
(a) Used for computing return on average GE shareowners’ equity and return on average total capital invested (ROTC).
(b) On an annual basis, calculated using a five-point average.
Our ROTC calculation excludes earnings (losses) of discontinued
operations from the numerator because U.S. GAAP requires us
to display those earnings (losses) in the Statement of Earnings.
Our calculation of average GE shareowners’ equity may not be
directly comparable to similarly titled measures reported by
other companies. We believe that it is a clearer way to measure
the ongoing trend in return on total capital for the continuing
operations of our businesses given the extent that discontinued
operations have affected our reported results. We believe that
this results in a more relevant measure for management and
investors to evaluate performance of our continuing operations,
on a consistent basis, and to evaluate and compare the perfor-
mance of our continuing operations with the ongoing operations
of other businesses and companies.
Defi nitions indicating how the above-named ratios are calcu-
lated using average GE shareowners’ equity, excluding effects of
discontinued operations, can be found in the Glossary.
Ratio of Adjusted Debt to Equity at GECC, Net of Adjusted Cash and Equivalents and with Classification of Hybrid Debt as Equity
December 31 (Dollars in millions) 2013 2012 2011 2010 2009
GECC debt $ 371,062 $ 397,039 $ 442,830 $ 470,363 $ 493,224
Add debt of businesses held for sale and discontinued operations 316 403 527 575 7,136
Adjusted GECC debt 371,378 397,442 443,357 470,938 500,360
Less cash and equivalents 74,873 61,853 76,641 60,231 62,565
Less cash of businesses held for sale and discontinued operations 236 265 332 222 1,975
Less hybrid debt 7,725 7,725 7,725 7,725 7,725
$ 288,544 $ 327,599 $ 358,659 $ 402,760 $ 428,095
GECC equity $ 82,694 $ 81,890 $ 77,110 $ 68,984 $ 70,833
Plus hybrid debt 7,725 7,725 7,725 7,725 7,725
$ 90,419 $ 89,615 $ 84,835 $ 76,709 $ 78,558
Ratio 3.19:1 3.66:1 4.23:1 5.25:1 5.45:1
We have provided the GECC ratio of debt to equity on a basis that
refl ects the use of cash and equivalents as a reduction of debt,
and long-term debt due in 2066 and 2067 classifi ed as equity.
For purposes of this ratio, we have also adjusted cash and debt
balances to include amounts classifi ed as assets and liabilities of
businesses held for sale and discontinued operations. We believe
that this is a useful comparison to a GAAP-based ratio of debt to
equity because cash balances may be used to reduce debt and
because this long-term debt has equity-like characteristics. The
usefulness of this supplemental measure may be limited, how-
ever, as the total amount of cash and equivalents at any point in
time may be different than the amount that could practically be
applied to reduce outstanding debt, and it may not be advanta-
geous or practical to replace certain long-term debt with equity.
Despite these potential limitations, we believe that this measure,
considered along with the corresponding GAAP measure, pro-
vides investors with additional information that may be more
comparable to other fi nancial institutions and businesses.