GE 2013 Annual Report Download - page 140
Download and view the complete annual report
Please find page 140 of the 2013 GE annual report below. You can navigate through the pages in the report by either clicking on the pages listed below, or by using the keyword search tool below to find specific information within the annual report.-
 1
1 -
2
-
3
-
4
-
5
-
6
-
7
-
8
-
9
-
10
-
11
-
12
-
13
-
14
-
15
-
16
-
17
-
18
-
19
-
20
-
21
-
22
-
23
-
24
-
25
-
26
-
27
-
28
-
29
-
30
-
31
-
32
-
33
-
34
-
35
-
36
-
37
-
38
-
39
-
40
-
41
-
42
-
43
-
44
-
45
-
46
-
47
-
48
-
49
-
50
-
51
-
52
-
53
-
54
-
55
-
56
-
57
-
58
-
59
-
60
-
61
-
62
-
63
-
64
-
65
-
66
-
67
-
68
-
69
-
70
-
71
-
72
-
73
-
74
-
75
-
76
-
77
-
78
-
79
-
80
-
81
-
82
-
83
-
84
-
85
-
86
-
87
-
88
-
89
-
90
-
91
-
92
-
93
-
94
-
95
-
96
-
97
-
98
-
99
-
100
-
101
-
102
-
103
-
104
-
105
-
106
-
107
-
108
-
109
-
110
-
111
-
112
-
113
-
114
-
115
-
116
-
117
-
118
-
119
-
120
-
121
-
122
-
123
-
124
-
125
-
126
-
127
-
128
-
129
-
 130
130 -
 131
131 -
 132
132 -
 133
133 -
 134
134 -
 135
135 -
 136
136 -
 137
137 -
 138
138 -
 139
139 -
 140
140 -
 141
141 -
 142
142 -
 143
143 -
 144
144 -
 145
145 -
 146
146 -
 147
147 -
 148
148 -
 149
149 -
 150
150
 |
 |

138 GE 2013 ANNUAL REPORT
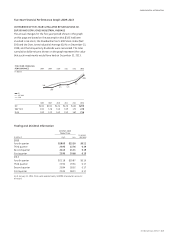
Note 28.
Quarterly Information (Unaudited)
First quarter Second quarter Third quarter Fourth quarter
(In millions; per-share amounts in dollars) 2013 2012 2013 2012 2013 2012 2013 2012
CONSOLIDATED OPERATIONS
Earnings from continuing operations $ 3,631 $ 3,257 $ 3,423 $ 3,681 $ 3,272 $ 3,460 $ 5,149 $ 4,449
Earnings (loss) from discontinued operations (120) (185) (124) (543) (91) 48 (1,785) (303)
Net earnings 3,511 3,072 3,299 3,138 3,181 3,508 3,364 4,146
Less net earnings attributable to
noncontrolling interests (16) 38 166 33 (10) 17 158 135
Net earnings attributable to the Company $ 3,527 $ 3,034 $ 3,133 $ 3,105 $ 3,191 $ 3,491 $ 3,206 $ 4,011
Per-share amounts—earnings from
continuing operations
Diluted earnings per share $ 0.35 $ 0.30 $ 0.31 $ 0.34 $ 0.32 $ 0.33 $ 0.49 $ 0.41
Basic earnings per share 0.35 0.30 0.32 0.34 0.32 0.33 0.49 0.41
Per-share amounts—earnings (loss) from
discontinued operations
Diluted earnings per share (0.01) (0.02) (0.01) (0.05) (0.01) — (0.18) (0.03)
Basic earnings per share (0.01) (0.02) (0.01) (0.05) (0.01) — (0.18) (0.03)
Per-share amounts—net earnings
Diluted earnings per share 0.34 0.29 0.30 0.29 0.31 0.33 0.32 0.38
Basic earnings per share 0.34 0.29 0.30 0.29 0.31 0.33 0.32 0.38
SELECTED DATA
GE
Sales of goods and services $ 22,303 $ 23,687 $ 24,623 $ 25,138 $ 25,262 $ 24,749 $ 28,826 $ 27,301
Gross profit from sales 4,867 5,653 6,007 5,800 5,691 6,025 6,819 8,341
GECC
Total revenues 11,468 11,267 10,916 11,285 10,606 11,207 11,077 11,605
Earnings from continuing operations
attributable to the Company 1,938 1,760 1,924 2,112 1,903 1,668 2,493 1,805
For GE, gross profi t from sales is sales of goods and services less costs of goods and services sold.
Earnings-per-share amounts are computed independently each quarter for earnings from continuing operations, earnings (loss) from
discontinued operations and net earnings. As a result, the sum of each quarter’s per-share amount may not equal the total per-share
amount for the respective year; and the sum of per-share amounts from continuing operations and discontinued operations may not
equal the total per-share amounts for net earnings for the respective quarters.