GE 2013 Annual Report Download - page 96
Download and view the complete annual report
Please find page 96 of the 2013 GE annual report below. You can navigate through the pages in the report by either clicking on the pages listed below, or by using the keyword search tool below to find specific information within the annual report.-
 1
1 -
2
-
3
-
4
-
5
-
6
-
7
-
8
-
9
-
10
-
11
-
12
-
13
-
14
-
15
-
16
-
17
-
18
-
19
-
20
-
21
-
22
-
23
-
24
-
25
-
26
-
27
-
28
-
29
-
30
-
31
-
32
-
33
-
34
-
35
-
36
-
37
-
38
-
39
-
40
-
41
-
42
-
43
-
44
-
45
-
46
-
47
-
48
-
49
-
50
-
51
-
52
-
53
-
54
-
55
-
56
-
57
-
58
-
59
-
60
-
61
-
62
-
63
-
64
-
65
-
66
-
67
-
68
-
69
-
70
-
71
-
72
-
73
-
74
-
75
-
76
-
77
-
78
-
79
-
80
-
81
-
82
-
83
-
84
-
85
-
 86
86 -
 87
87 -
 88
88 -
 89
89 -
 90
90 -
 91
91 -
 92
92 -
 93
93 -
 94
94 -
 95
95 -
 96
96 -
 97
97 -
 98
98 -
 99
99 -
 100
100 -
 101
101 -
 102
102 -
 103
103 -
 104
104 -
 105
105 -
 106
106 -
107
-
108
-
109
-
110
-
111
-
112
-
113
-
114
-
115
-
116
-
117
-
118
-
119
-
120
-
121
-
122
-
123
-
124
-
125
-
126
-
127
-
128
-
129
-
130
-
131
-
132
-
133
-
134
-
135
-
136
-
137
-
138
-
139
-
140
-
141
-
142
-
143
-
144
-
145
-
146
-
147
-
148
-
149
-
150
 |
 |

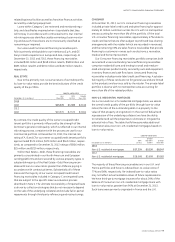
94 GE 2013 ANNUAL REPORT
(In millions)
Balance at
January 1,
2012
Provision
charged to
operations Other (a) Gross
write-offs (b) Recoveries (b)
Balance at
December 31,
2012
COMMERCIAL
CLL
Americas $ 889 $ 109 $ (51) $ (568) $ 111 $ 490
Europe 400 374 (3) (390) 64 445
Asia 157 37 (3) (134) 23 80
Other 4 13 (1) (10) — 6
Total CLL 1,450 533 (58) (1,102) 198 1,021
Energy Financial Services 26 4 — (24) 3 9
GECAS 17 4 — (13) — 8
Other 37 1 (20) (17) 2 3
Total Commercial 1,530 542 (78) (1,156) 203 1,041
REAL ESTATE 1,089 72 (44) (810) 13 320
CONSUMER
Non-U.S. residential mortgages 545 112 8 (261) 76 480
Non-U.S. installment and revolving credit 690 290 24 (974) 552 582
U.S. installment and revolving credit 2,008 2,666 (24) (2,906) 538 2,282
Non-U.S. auto 101 18 (4) (146) 98 67
Other 199 132 18 (257) 80 172
Total Consumer 3,543 3,218 22 (4,544) 1,344 3,583
Total $ 6,162 $ 3,832 $ (100) $ (6,510) $ 1,560 $ 4,944
(a) Other primarily included transfers to held-for-sale and the effects of currency exchange.
(b) Net write-offs (gross write-offs less recoveries) in certain portfolios may exceed the beginning allowance for losses as a result of losses that are incurred subsequent to the
beginning of the fiscal year due to information becoming available during the current year, which may identify further deterioration on existing financing receivables.
(In millions)
Balance at
January 1,
2011
Provision
charged to
operations (a) Other (b) Gross
write-offs (c) Recoveries (c)
Balance at
December 31,
2011
COMMERCIAL
CLL
Americas $1,288 $ 281 $ (96) $ (700) $ 116 $ 889
Europe 429 195 (5) (286) 67 400
Asia 222 105 13 (214) 31 157
Other 6 3 (3) (2) — 4
Total CLL 1,945 584 (91) (1,202) 214 1,450
Energy Financial Services 22 — (1) (4) 9 26
GECAS 20 — — (3) — 17
Other 58 23 — (47) 3 37
Total Commercial 2,045 607 (92) (1,256) 226 1,530
REAL ESTATE 1,488 324 2 (747) 22 1,089
CONSUMER
Non-U.S. residential mortgages 688 116 (13) (295) 49 545
Non-U.S. installment and revolving credit 898 470 (29) (1,198) 549 690
U.S. installment and revolving credit 2,333 2,241 1 (3,095) 528 2,008
Non-U.S. auto 168 30 (4) (216) 123 101
Other 259 142 (20) (272) 90 199
Total Consumer 4,346 2,999 (65) (5,076) 1,339 3,543
Total $7,879 $3,930 $(155) $(7,079) $1,587 $6,162
(a) Included a provision of $77 million at Consumer related to the July 1, 2011 adoption of ASU 2011-02.
(b) Other primarily included transfers to held-for-sale and the effects of currency exchange.
(c) Net write-offs (gross write-offs less recoveries) in certain portfolios may exceed the beginning allowance for losses as a result of losses that are incurred subsequent to the
beginning of the fiscal year due to information becoming available during the current year, which may identify further deterioration on existing financing receivables.
Credit Quality Indicators
We provide further detailed information about the credit quality of our Commercial, Real Estate and Consumer fi nancing receivables
portfolios. For each portfolio, we describe the characteristics of the fi nancing receivables and provide information about collateral, pay-
ment performance, credit quality indicators, and impairment. We manage these portfolios using delinquency and nonearning data as
key performance indicators. The categories used within this section such as impaired loans, TDR and nonaccrual fi nancing receivables
are defi ned by the authoritative guidance and we base our categorization on the related scope and defi nitions contained in the related
standards. The categories of nonearning and delinquent are defi ned by us and are used in our process for managing our fi nancing
receivables. Defi nitions of these categories are provided in Note 1.