GE 2013 Annual Report Download - page 3
Download and view the complete annual report
Please find page 3 of the 2013 GE annual report below. You can navigate through the pages in the report by either clicking on the pages listed below, or by using the keyword search tool below to find specific information within the annual report.-
 1
1 -
 2
2 -
 3
3 -
 4
4 -
 5
5 -
 6
6 -
 7
7 -
 8
8 -
 9
9 -
 10
10 -
 11
11 -
 12
12 -
 13
13 -
 14
14 -
15
-
16
-
17
-
18
-
19
-
20
-
21
-
22
-
23
-
24
-
25
-
26
-
27
-
28
-
29
-
30
-
31
-
32
-
33
-
34
-
35
-
36
-
37
-
38
-
39
-
40
-
41
-
42
-
43
-
44
-
45
-
46
-
47
-
48
-
49
-
50
-
51
-
52
-
53
-
54
-
55
-
56
-
57
-
58
-
59
-
60
-
61
-
62
-
63
-
64
-
65
-
66
-
67
-
68
-
69
-
70
-
71
-
72
-
73
-
74
-
75
-
76
-
77
-
78
-
79
-
80
-
81
-
82
-
83
-
84
-
85
-
86
-
87
-
88
-
89
-
90
-
91
-
92
-
93
-
94
-
95
-
96
-
97
-
98
-
99
-
100
-
101
-
102
-
103
-
104
-
105
-
106
-
107
-
108
-
109
-
110
-
111
-
112
-
113
-
114
-
115
-
116
-
117
-
118
-
119
-
120
-
121
-
122
-
123
-
124
-
125
-
126
-
127
-
128
-
129
-
130
-
131
-
132
-
133
-
134
-
135
-
136
-
137
-
138
-
139
-
140
-
141
-
142
-
143
-
144
-
145
-
146
-
147
-
148
-
149
-
150
 |
 |

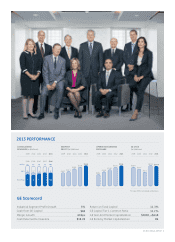
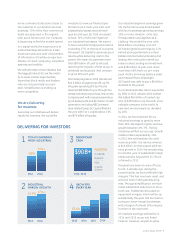
GE CFOA
(In $ billions)
*Excludes NBCUniversal deal-related taxes
2009 2010 2011 2012 2013
$16.4
$14.7
$12.1
$17.8 $17.4*
CONSOLIDATED
REVENUES (In $ billions)
2009 2010 2011 2012 2013
15
$154
CAPITAL
NBCU
INDUSTRIAL
2
$147
2
$146
17
$149
6
51 45 4449 48
$147
SEGMENT
PROFIT (In $ billions)
2009 2010 2011 2012 2013
$15.7 $17.2
$20.5
$22.8 $24.5
OPERATING EARNINGS
PER SHARE
2009 2010 2011 2012 2013
$0.91
$1.13
$1.30
$1.51 $1.64
88 83 93 100 100
2013 PERFORMANCE
GE Scorecard
Industrial Segment Profi t Growth 5%
Cash from GE Capital $6B
Margin Growth 60bps
Cash Returned to Investors $18.2B
Return on Total Capital 11.3%
GE Capital Tier 1 Common Ratio 11.2%
GE Year-End Market Capitalization $282B, +$64B
GE Rank by Market Capitalization #6
GE 2013 ANNUAL REPORT 1