HSBC 2002 Annual Report Download - page 261
Download and view the complete annual report
Please find page 261 of the 2002 HSBC annual report below. You can navigate through the pages in the report by either clicking on the pages listed below, or by using the keyword search tool below to find specific information within the annual report.-
 1
1 -
2
-
3
-
4
-
5
-
6
-
7
-
8
-
9
-
10
-
11
-
12
-
13
-
14
-
15
-
16
-
17
-
18
-
19
-
20
-
21
-
22
-
23
-
24
-
25
-
26
-
27
-
28
-
29
-
30
-
31
-
32
-
33
-
34
-
35
-
36
-
37
-
38
-
39
-
40
-
41
-
42
-
43
-
44
-
45
-
46
-
47
-
48
-
49
-
50
-
51
-
52
-
53
-
54
-
55
-
56
-
57
-
58
-
59
-
60
-
61
-
62
-
63
-
64
-
65
-
66
-
67
-
68
-
69
-
70
-
71
-
72
-
73
-
74
-
75
-
76
-
77
-
78
-
79
-
80
-
81
-
82
-
83
-
84
-
85
-
86
-
87
-
88
-
89
-
90
-
91
-
92
-
93
-
94
-
95
-
96
-
97
-
98
-
99
-
100
-
101
-
102
-
103
-
104
-
105
-
106
-
107
-
108
-
109
-
110
-
111
-
112
-
113
-
114
-
115
-
116
-
117
-
118
-
119
-
120
-
121
-
122
-
123
-
124
-
125
-
126
-
127
-
128
-
129
-
130
-
131
-
132
-
133
-
134
-
135
-
136
-
137
-
138
-
139
-
140
-
141
-
142
-
143
-
144
-
145
-
146
-
147
-
148
-
149
-
150
-
151
-
152
-
153
-
154
-
155
-
156
-
157
-
158
-
159
-
160
-
161
-
162
-
163
-
164
-
165
-
166
-
167
-
168
-
169
-
170
-
171
-
172
-
173
-
174
-
175
-
176
-
177
-
178
-
179
-
180
-
181
-
182
-
183
-
184
-
185
-
186
-
187
-
188
-
189
-
190
-
191
-
192
-
193
-
194
-
195
-
196
-
197
-
198
-
199
-
200
-
201
-
202
-
203
-
204
-
205
-
206
-
207
-
208
-
209
-
210
-
211
-
212
-
213
-
214
-
215
-
216
-
217
-
218
-
219
-
220
-
221
-
222
-
223
-
224
-
225
-
226
-
227
-
228
-
229
-
230
-
231
-
232
-
233
-
234
-
235
-
236
-
237
-
238
-
239
-
240
-
241
-
242
-
243
-
244
-
245
-
246
-
247
-
248
-
249
-
250
-
 251
251 -
 252
252 -
 253
253 -
 254
254 -
 255
255 -
 256
256 -
 257
257 -
 258
258 -
 259
259 -
 260
260 -
 261
261 -
 262
262 -
 263
263 -
 264
264 -
 265
265 -
 266
266 -
 267
267 -
 268
268 -
 269
269 -
 270
270 -
 271
271 -
272
-
273
-
274
-
275
-
276
-
277
-
278
-
279
-
280
-
281
-
282
-
283
-
284
-
285
-
286
-
287
-
288
-
289
-
290
-
291
-
292
-
293
-
294
-
295
-
296
-
297
-
298
-
299
-
300
-
301
-
302
-
303
-
304
-
305
-
306
-
307
-
308
-
309
-
310
-
311
-
312
-
313
-
314
-
315
-
316
-
317
-
318
-
319
-
320
-
321
-
322
-
323
-
324
-
325
-
326
-
327
-
328
-
329
 |
 |
259
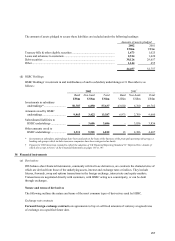
constantly to ensure that they are within acceptable risk levels, with offsetting deals being undertaken to achieve
this where necessary. As well as acting as a dealer, HSBC also uses derivatives (principally interest rate swaps)
in the management of its own asset and liability portfolios and structural positions.
Risks associated with derivatives
Derivative instruments are subject to both market risk and credit risk.
Market risk
The market risk associated with derivatives can be significant since large positions can be accumulated with a
substantially smaller initial outlay than required in cash markets. Recognising this, only certain offices within
major subsidiaries with sufficient derivative product expertise and appropriate control systems are authorised to
trade derivative products. The management of market risk arising from derivatives business is monitored by
Traded Markets Development and Risk, an independent unit within the Corporate Investment Banking and
Markets operation, in combination with market risks arising from on-balance-sheet instruments (Note 40).
Credit risk
Unlike assets recorded on the balance sheet, where the credit risk is typically the full amount of the principal
value, together with any unrealised interest accrued or mark-to-market gain (Note 14), the credit risk relative to
a derivative is principally the replacement cost of any contract with a positive mark-to-market gain and an
estimate for the potential future change in value, reflecting the volatilities affecting the contract. Credit risk on
contracts having a negative mark-to-market value is restricted to the potential future change in value. Credit risk
on derivatives is, therefore, small in relation to a comparable balance sheet risk. In addition, credit exposure
with individual counterparties can be reduced by the receipt of collateral and close-out netting agreements
which allow for positive and negative mark-to-market values on different transactions to be offset and settled by
a single payment in the event of default by either party. Such agreements are enforceable in the jurisdictions of
the major market makers and HSBC has executed close-out netting agreements with the majority of its
counterparties, notwithstanding the fact that HSBC deals only with the most creditworthy counterparties.
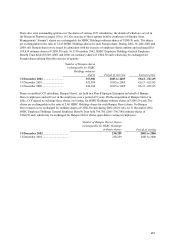
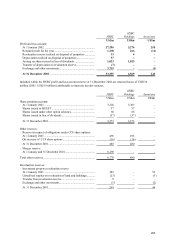
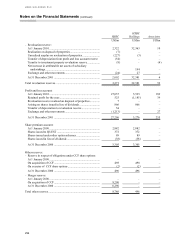
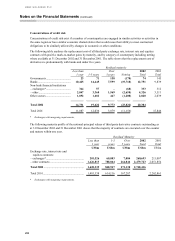
Derivatives used for trading purposes
The following tables summarise the contract amount, replacement cost, mark-to-market values and average
mark-to-market values of third party and internal trading derivatives by product type. The replacement cost
shown is the positive mark-to-market value and represents the accounting loss HSBC would incur if the
counterparty to a derivative contract failed to perform according to the terms of the contract and the collateral, if
any, for the amount due proved to be of no value.
The notional or contractual amounts of these instruments indicate the volume of transactions outstanding at the
balance sheet date; they do not represent amounts at risk.
Because all derivative instruments used for trading purposes are marked to market, carrying values are equal to
mark-to-market values. Mark-to-market values are determined by reference to market rates prevailing on the
date of valuation or by discounting future cash flows and include netted internal positions, except where
otherwise indicated.