HSBC 2002 Annual Report Download - page 85
Download and view the complete annual report
Please find page 85 of the 2002 HSBC annual report below. You can navigate through the pages in the report by either clicking on the pages listed below, or by using the keyword search tool below to find specific information within the annual report.-
 1
1 -
2
-
3
-
4
-
5
-
6
-
7
-
8
-
9
-
10
-
11
-
12
-
13
-
14
-
15
-
16
-
17
-
18
-
19
-
20
-
21
-
22
-
23
-
24
-
25
-
26
-
27
-
28
-
29
-
30
-
31
-
32
-
33
-
34
-
35
-
36
-
37
-
38
-
39
-
40
-
41
-
42
-
43
-
44
-
45
-
46
-
47
-
48
-
49
-
50
-
51
-
52
-
53
-
54
-
55
-
56
-
57
-
58
-
59
-
60
-
61
-
62
-
63
-
64
-
65
-
66
-
67
-
68
-
69
-
70
-
71
-
72
-
73
-
74
-
 75
75 -
 76
76 -
 77
77 -
 78
78 -
 79
79 -
 80
80 -
 81
81 -
 82
82 -
 83
83 -
 84
84 -
 85
85 -
 86
86 -
 87
87 -
 88
88 -
 89
89 -
 90
90 -
 91
91 -
 92
92 -
 93
93 -
 94
94 -
 95
95 -
96
-
97
-
98
-
99
-
100
-
101
-
102
-
103
-
104
-
105
-
106
-
107
-
108
-
109
-
110
-
111
-
112
-
113
-
114
-
115
-
116
-
117
-
118
-
119
-
120
-
121
-
122
-
123
-
124
-
125
-
126
-
127
-
128
-
129
-
130
-
131
-
132
-
133
-
134
-
135
-
136
-
137
-
138
-
139
-
140
-
141
-
142
-
143
-
144
-
145
-
146
-
147
-
148
-
149
-
150
-
151
-
152
-
153
-
154
-
155
-
156
-
157
-
158
-
159
-
160
-
161
-
162
-
163
-
164
-
165
-
166
-
167
-
168
-
169
-
170
-
171
-
172
-
173
-
174
-
175
-
176
-
177
-
178
-
179
-
180
-
181
-
182
-
183
-
184
-
185
-
186
-
187
-
188
-
189
-
190
-
191
-
192
-
193
-
194
-
195
-
196
-
197
-
198
-
199
-
200
-
201
-
202
-
203
-
204
-
205
-
206
-
207
-
208
-
209
-
210
-
211
-
212
-
213
-
214
-
215
-
216
-
217
-
218
-
219
-
220
-
221
-
222
-
223
-
224
-
225
-
226
-
227
-
228
-
229
-
230
-
231
-
232
-
233
-
234
-
235
-
236
-
237
-
238
-
239
-
240
-
241
-
242
-
243
-
244
-
245
-
246
-
247
-
248
-
249
-
250
-
251
-
252
-
253
-
254
-
255
-
256
-
257
-
258
-
259
-
260
-
261
-
262
-
263
-
264
-
265
-
266
-
267
-
268
-
269
-
270
-
271
-
272
-
273
-
274
-
275
-
276
-
277
-
278
-
279
-
280
-
281
-
282
-
283
-
284
-
285
-
286
-
287
-
288
-
289
-
290
-
291
-
292
-
293
-
294
-
295
-
296
-
297
-
298
-
299
-
300
-
301
-
302
-
303
-
304
-
305
-
306
-
307
-
308
-
309
-
310
-
311
-
312
-
313
-
314
-
315
-
316
-
317
-
318
-
319
-
320
-
321
-
322
-
323
-
324
-
325
-
326
-
327
-
328
-
329
 |
 |

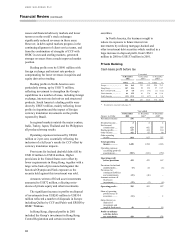
83
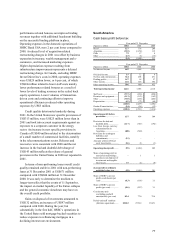
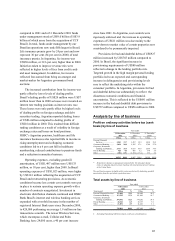
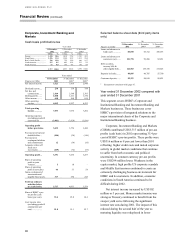
Personal Financial Services
Cash basis profit before tax
Year ended
31 December
2002
31 December
2001*
31 December
2000*
US$m % US$m % US$m %
Europe ................................ 987 27.8 1,091 31.6 624 20.7
Hong Kong ......................... 1,705 48.1 1,631 47.2 1,680 55.8
Rest of Asia-Pacific............. 127 3.6 80 2.3 189 6.3
North America .................... 757 21.4 593 17.1 482 16.0
South America .................... (33 ) (0.9) 62 1.8 35 1.2
3,543 100.0 3,457 100.0 3,010 100.0
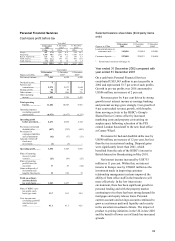
Year ended
Figures in US$m 31 December
2002
31 December
2001*
31 December
2000*
Net interest income....... 7,581 6,828 6,508
Dividend income .......... 651
Net fees and
commissions ............ 2,979 2,877 2,644
Dealing profits.............. 50 53 97
Other income................ 788 806 711
Other operating
income ..................... 3,823 3,741 3,453
Total operating
income..................... 11,404 10,569 9,961
Operating expenses
(excluding goodwill
amortisation)............ (6,973) (6,477 ) (6,237)
Operating profit
before provisions.... 4,431 4,092 3,724
Provisions for bad and
doubtful debts .......... (857 ) (767) (602)
Provisions for
contingent liabilities
and commitments (42 ) (17 ) (31)
Amounts written off
fixed asset
investments.............. (2 ) (5 )
–
Operating profit.......... 3,530 3,303 3,091
Share of operating
(losses) in joint
ventures ................... (23 ) (99 ) (52)
Share of operating
profit/(losses) in
associates 17 43 (44)
Gains on disposal of
investments and
tangible fixed assets. 19 210 15
Profit on ordinary
activities before
tax (cash basis) ....... 3,543 3,457 3,010
Share of HSBC’ s pre-
tax profits (cash
basis) (per cent) 33.7 39.3 29.2
Cost: income ratio
(excluding goodwill
amotisation) (per
cent)......................... 61.1 61.3 62.6
Selected balance sheet data (third party items
only)
At
Figures in US$m 31 December
2002
31 December
2001*
31 December
2000*
Loans and advances to
customers (net)........ 143,696 113,844 103,901
Customer deposits........ 257,880 228,931 216,058
*Restatement consistent with page 81.
Year ended 31 December 2002 compared with
year ended 31 December 2001
On a cash basis Personal Financial Services
contributed US$3,543 million to pre-tax profits in
2002 and represented 33.7 per cent of such profits.
Growth in pre-tax profits over 2001 amounted to
US$86 million, an increase of 2 per cent.
Revenues grew by 8 per cent driven by strong
growth in net interest income as mortage banking
and personal savings grew strongly. Cost growth of
8 per cent tracked revenue growth, with benefits
from moving activity to the HSBC’s Group’s
Shared Service Centres offset by increased
marketing costs and property costs arising on
surplus space following relocation of the PFS
central London based staff to the new head office
at Canary Wharf.
Provisions for bad and doubtful debts rose by
US$90 million, an increase of 12 per cent, but less
than the rise in customer lending. Disposal gains
were significantly lower than 2001, which
benefited from the sale of the HSBC’s interest in
British Interactive Broadcasting in May 2001.
Net interest income increased by US$753
million or 11 per cent. Within this, net interest
income in Europe rose by US$405 million as the
investment made in improving customer
relationship management systems improved the
ability of front office staff in the branches to sell
more effectively. In the low interest rate
environment, there has been significant growth in
personal lending and with the property market
continuing to rise there has been strong demand for
mortgages and equity release loans. Personal
current accounts and savings accounts continued to
grow as customers preferred liquidity and security
in the uncertain investment climate. The impact of
product re-pricing initiatives in the UK in late 2001
and the benefit of lower cost of funds has increased
spreads.