HSBC 2002 Annual Report Download - page 73
Download and view the complete annual report
Please find page 73 of the 2002 HSBC annual report below. You can navigate through the pages in the report by either clicking on the pages listed below, or by using the keyword search tool below to find specific information within the annual report.-
 1
1 -
2
-
3
-
4
-
5
-
6
-
7
-
8
-
9
-
10
-
11
-
12
-
13
-
14
-
15
-
16
-
17
-
18
-
19
-
20
-
21
-
22
-
23
-
24
-
25
-
26
-
27
-
28
-
29
-
30
-
31
-
32
-
33
-
34
-
35
-
36
-
37
-
38
-
39
-
40
-
41
-
42
-
43
-
44
-
45
-
46
-
47
-
48
-
49
-
50
-
51
-
52
-
53
-
54
-
55
-
56
-
57
-
58
-
59
-
60
-
61
-
62
-
 63
63 -
 64
64 -
 65
65 -
 66
66 -
 67
67 -
 68
68 -
 69
69 -
 70
70 -
 71
71 -
 72
72 -
 73
73 -
 74
74 -
 75
75 -
 76
76 -
 77
77 -
 78
78 -
 79
79 -
 80
80 -
 81
81 -
 82
82 -
 83
83 -
84
-
85
-
86
-
87
-
88
-
89
-
90
-
91
-
92
-
93
-
94
-
95
-
96
-
97
-
98
-
99
-
100
-
101
-
102
-
103
-
104
-
105
-
106
-
107
-
108
-
109
-
110
-
111
-
112
-
113
-
114
-
115
-
116
-
117
-
118
-
119
-
120
-
121
-
122
-
123
-
124
-
125
-
126
-
127
-
128
-
129
-
130
-
131
-
132
-
133
-
134
-
135
-
136
-
137
-
138
-
139
-
140
-
141
-
142
-
143
-
144
-
145
-
146
-
147
-
148
-
149
-
150
-
151
-
152
-
153
-
154
-
155
-
156
-
157
-
158
-
159
-
160
-
161
-
162
-
163
-
164
-
165
-
166
-
167
-
168
-
169
-
170
-
171
-
172
-
173
-
174
-
175
-
176
-
177
-
178
-
179
-
180
-
181
-
182
-
183
-
184
-
185
-
186
-
187
-
188
-
189
-
190
-
191
-
192
-
193
-
194
-
195
-
196
-
197
-
198
-
199
-
200
-
201
-
202
-
203
-
204
-
205
-
206
-
207
-
208
-
209
-
210
-
211
-
212
-
213
-
214
-
215
-
216
-
217
-
218
-
219
-
220
-
221
-
222
-
223
-
224
-
225
-
226
-
227
-
228
-
229
-
230
-
231
-
232
-
233
-
234
-
235
-
236
-
237
-
238
-
239
-
240
-
241
-
242
-
243
-
244
-
245
-
246
-
247
-
248
-
249
-
250
-
251
-
252
-
253
-
254
-
255
-
256
-
257
-
258
-
259
-
260
-
261
-
262
-
263
-
264
-
265
-
266
-
267
-
268
-
269
-
270
-
271
-
272
-
273
-
274
-
275
-
276
-
277
-
278
-
279
-
280
-
281
-
282
-
283
-
284
-
285
-
286
-
287
-
288
-
289
-
290
-
291
-
292
-
293
-
294
-
295
-
296
-
297
-
298
-
299
-
300
-
301
-
302
-
303
-
304
-
305
-
306
-
307
-
308
-
309
-
310
-
311
-
312
-
313
-
314
-
315
-
316
-
317
-
318
-
319
-
320
-
321
-
322
-
323
-
324
-
325
-
326
-
327
-
328
-
329
 |
 |
71
million in 2000. The receipt of previously suspended
interest resulted in a significant increase in net
interest income. Increased operating expenses
reflected increased headcount arising on business
expansion in personal financial services preparing for
opportunities which will arise as China’s banking
markets open post its accession to the World Trade
Organisation together with expansion of the global
processing centre in Guangzhou. Costs in respect of
the latter were largely offset by other operating
income received for these services. Business
expansion together with development of the
processing centre at Guangzhou resulted in an
increased headcount of some 500 during the year.
Consistent with the recovery of suspended interest
there was a net release in bad debt provisions for
2001 compared with a charge of US$24 million in
2000.
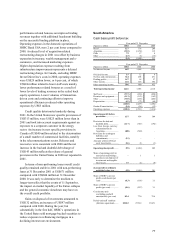
In Malaysia, HSBC Bank Malaysia reported
profits before tax of US$131 million, an increase of
US$15 million, 13 per cent higher than in 2000. This
was largely attributable to a lower level of provisions
for bad and doubtful debts.
Against a backdrop of subdued corporate loan
demand, intense price competition and reduced
lending margins net interest income of US$171
million was slightly lower than in 2000. However
HSBC Bank Malaysia exceeded targeted growth in
residential mortgages (up US$569 million, an
increase of 91 per cent) and in credit card loans (up
US$70 million and reflecting a 50 per cent increase
in the number of credit cards in issue) following
successful promotional campaigns. As a consequence
the net interest margin improved by 5 basis points to
2.76 per cent. Spread widened by 17 basis points
mainly due to the impact of higher yielding
residential mortgage and credit card loans and lower
cost of funds in a falling interest rate environment.
The contribution from net free funds fell by 12 basis
points reflecting lower interest rates and a reduced
volume of interest free account balances as foreign
investors repatriated surplus funds.
Other operating income of US$91 million was
US$7 million higher than in 2000. The continuing
focus on expanding HSBC’s personal banking
operations generated a 15 per cent increase in credit
card fee income to US$26 million. Higher profits
from bond trading and higher volumes of foreign
exchange transactions resulted in a 13 per cent
increase in dealing profits to US$34 million.
Operating expenses at US$134 million were US$15
million higher than 2000.
Operating expenses, other than staff costs
increased by 31 per cent mainly due to an increase in
marketing initiatives to support strategic
repositioning to focus more on Personal Financial
Services.
Provisions for bad and doubtful debts decreased
by US$26 million to US$7 million. Non-performing
customer loans have decreased by US$126 million or
18 per cent since 31 December 2000 as a result of a
combination of credit upgrades following loan
restructurings, recoveries and write-offs.
The Middle Eastern operations of HSBC Bank
Middle East benefited from the expansion of fee
income from personal banking business and a lower
charge for bad and doubtful debt provisions. Cash
basis pre-tax profits were US$40 million, 23 per cent
higher than in 2000.
Net interest income was in line with 2000 as the
benefit of increased levels of average interest-earning
assets offset a fall in net interest margin. Intense
competition for the limited quality lending
opportunities resulted in a fall in average customer
advances as scheduled repayments were received. As
a result growth in average interest-earning assets of
US$301 million or 4 per cent, was deposit-driven
and was placed in lower-yielding money market
loans. The 12 basis point fall in net interest margin to
3.84 per cent reflected the more liquid balance sheet
and a lower contribution from net free funds in the
falling interest rate environment.
Anticipating the pressure on lending income
growth HSBC Bank Middle East focused marketing
activity on fee based products generating net fee
income US$15 million, or 19 per cent, higher than
2000 as a result of growth in personal banking
products. This was the major contributor to growth in
other operating income of US$20 million, or 17 per
cent higher than in 2000. HSBC’s financial planning
management service (which provides savings,
retirement, education and protection planning
services in six countries in the region) contributed
US$10 million of net fees in its first full year of
operations, an increase of US$7 million. Credit card
fee income increased by US$3 million, or 15 per
cent, following fresh promotion of credit card
products, backed by the launch of a new loyalty
programme and a virtual card which facilitates
secure financial internet transactions. The number of
credit cards in issue increased by 25 per cent and