HSBC 2002 Annual Report Download - page 64
Download and view the complete annual report
Please find page 64 of the 2002 HSBC annual report below. You can navigate through the pages in the report by either clicking on the pages listed below, or by using the keyword search tool below to find specific information within the annual report.-
 1
1 -
2
-
3
-
4
-
5
-
6
-
7
-
8
-
9
-
10
-
11
-
12
-
13
-
14
-
15
-
16
-
17
-
18
-
19
-
20
-
21
-
22
-
23
-
24
-
25
-
26
-
27
-
28
-
29
-
30
-
31
-
32
-
33
-
34
-
35
-
36
-
37
-
38
-
39
-
40
-
41
-
42
-
43
-
44
-
45
-
46
-
47
-
48
-
49
-
50
-
51
-
52
-
53
-
 54
54 -
 55
55 -
 56
56 -
 57
57 -
 58
58 -
 59
59 -
 60
60 -
 61
61 -
 62
62 -
 63
63 -
 64
64 -
 65
65 -
 66
66 -
 67
67 -
 68
68 -
 69
69 -
 70
70 -
 71
71 -
 72
72 -
 73
73 -
 74
74 -
75
-
76
-
77
-
78
-
79
-
80
-
81
-
82
-
83
-
84
-
85
-
86
-
87
-
88
-
89
-
90
-
91
-
92
-
93
-
94
-
95
-
96
-
97
-
98
-
99
-
100
-
101
-
102
-
103
-
104
-
105
-
106
-
107
-
108
-
109
-
110
-
111
-
112
-
113
-
114
-
115
-
116
-
117
-
118
-
119
-
120
-
121
-
122
-
123
-
124
-
125
-
126
-
127
-
128
-
129
-
130
-
131
-
132
-
133
-
134
-
135
-
136
-
137
-
138
-
139
-
140
-
141
-
142
-
143
-
144
-
145
-
146
-
147
-
148
-
149
-
150
-
151
-
152
-
153
-
154
-
155
-
156
-
157
-
158
-
159
-
160
-
161
-
162
-
163
-
164
-
165
-
166
-
167
-
168
-
169
-
170
-
171
-
172
-
173
-
174
-
175
-
176
-
177
-
178
-
179
-
180
-
181
-
182
-
183
-
184
-
185
-
186
-
187
-
188
-
189
-
190
-
191
-
192
-
193
-
194
-
195
-
196
-
197
-
198
-
199
-
200
-
201
-
202
-
203
-
204
-
205
-
206
-
207
-
208
-
209
-
210
-
211
-
212
-
213
-
214
-
215
-
216
-
217
-
218
-
219
-
220
-
221
-
222
-
223
-
224
-
225
-
226
-
227
-
228
-
229
-
230
-
231
-
232
-
233
-
234
-
235
-
236
-
237
-
238
-
239
-
240
-
241
-
242
-
243
-
244
-
245
-
246
-
247
-
248
-
249
-
250
-
251
-
252
-
253
-
254
-
255
-
256
-
257
-
258
-
259
-
260
-
261
-
262
-
263
-
264
-
265
-
266
-
267
-
268
-
269
-
270
-
271
-
272
-
273
-
274
-
275
-
276
-
277
-
278
-
279
-
280
-
281
-
282
-
283
-
284
-
285
-
286
-
287
-
288
-
289
-
290
-
291
-
292
-
293
-
294
-
295
-
296
-
297
-
298
-
299
-
300
-
301
-
302
-
303
-
304
-
305
-
306
-
307
-
308
-
309
-
310
-
311
-
312
-
313
-
314
-
315
-
316
-
317
-
318
-
319
-
320
-
321
-
322
-
323
-
324
-
325
-
326
-
327
-
328
-
329
 |
 |

HSBC HOLDINGS PLC
Financial Review (continued)
62
million in respect of HSBC Bank plc’s 20 per cent
shareholding in British Interactive Broadcasting.
Gains on disposal of fixed assets of US$441
million included the US$200 million profit in the
first half of 2001, on the sale of HSBC Bank plc’s 20
per cent shareholding in British Interactive
Broadcasting. HSBC’s European results were also
bolstered by gains on disposal of the stake in Quilter
and by profits in Germany on the sale of our
fledgling internet broker Pulsiv and ERGO.
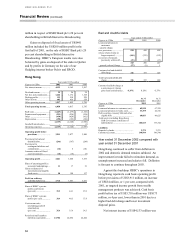
Hong Kong
Year ended 31 December
Figures in US$m 2002 2001 2000
Net interest income ............... 4,133 4,165 3,997
Dividend income................... 25 26 34
Net fees and commissions ..... 1,264 1,172 1,168
Dealing profits ...................... 133 218 229
Other income ........................ 495 436 359
Other operating income......... 1,917 1,852 1,790
Total operating income ....... 6,050 6,017 5,787
Staff costs ............................. (1,249) (1,279 ) (1,166)
Premises and equipmen
t
........ (233) (234) (218 )
Othe
r
.................................... (459) (428) (412 )
Depreciatio
n
.......................... (198) (199) (190 )
(2,139) (2,140 ) (1,986)
Goodwill amortisatio
n
...........
–
–
(1)
Operating expenses ............... (2,139 ) (2,140) (1,987)
Operating profit before
provisions ........................ 3,911 3,877 3,800
Provisions for bad and
doubtful debts................... (246 ) (197 ) (248)
Provisions for
contingent liabilities and
commitments.................... (14) 6 (10)
Amounts written off fixed
asset investments.............. (10) (18 ) (9)
Operating profit .................. 3,641 3,668 3,533
Share of operating profit in
associated undertakings .... 11 17 21
Gains on disposal of
investments and tangible
fixed assets....................... 58 198 137
Profit on ordinary
activities before tax......... 3,710 3,883 3,691
Share of HSBC’ s pre-tax
profits (cash basis)
(per cent).......................... 35.3 44.1 35.9
Share of HSBC’ s pre-tax
p
rofits (per cent)............... 38.4 48.5 37.8
Cost:income ratio
(excluding goodwill
amortisation)
(per cent).......................... 35.4 35.6 34.3
Period-end staff numbers
(full-time equivalent)........ 23,786 24,654 24,204
Bad and doubtful debts
Year ended 31 December
Figures in US$m 2002 2001 2000
Loans and advances to
customers
- specific charge
new provisions...................... 528 449 454
release of provisions no
longer require
d
................. (160) (212) (192 )
recoveries of amounts
p
reviously written of
f
....... (25 ) (31 ) (15)
343 206 247
- general (release)/charge...... (97) (9 ) 1
Customer bad and doubtful
debt charge....................... 246 197 248
Total bad and doubtful debt
charge .............................. 246 197 248
Customer bad debt charge as
a percentage of closing
gross loans and advances . 0.35% 0.29% 0.37%
Figures in US$m
At 31
December
2002
At 31
Decembe
r
2001
Assets
Loans and advances to customers (net)... 69,948 67,359
Loans and advances to banks (net).......... 33,359 42,516
Debt securities, treasury bills and other
eligible bills ...................................... 60,083 49,625
Total assets (excluding Hong Kong
SAR Government certificates of
indebtedness) ..................................... 180,525 175,744
Liabilities
Deposits by banks................................... 2,379 3,271
Customer accounts.................................. 148,904 146,544
Year ended 31 December 2002 compared with
year ended 31 December 2001
Hong Kong continued to suffer from deflation in
2002 and domestic demand remains subdued. An
improvement in trade failed to stimulate demand, as
unemployment increased and salaries fell. Deflation
is forecast to continue throughout 2003.
Against this backdrop HSBC’s operations in
Hong Kong reported a cash basis operating profit
before provisions of US$3,911 million, an increase
of US$34 million, or 1 per cent, compared with
2001, as targeted income growth from wealth
management products was achieved. Cash basis
profit before tax of US$3,710 million was US$173
million, or 4 per cent, lower than in 2001 due to a
higher bad debt charge and lower investment
disposal gains.
Net interest income of US$4,133 million was