HSBC 2002 Annual Report Download - page 83
Download and view the complete annual report
Please find page 83 of the 2002 HSBC annual report below. You can navigate through the pages in the report by either clicking on the pages listed below, or by using the keyword search tool below to find specific information within the annual report.-
 1
1 -
2
-
3
-
4
-
5
-
6
-
7
-
8
-
9
-
10
-
11
-
12
-
13
-
14
-
15
-
16
-
17
-
18
-
19
-
20
-
21
-
22
-
23
-
24
-
25
-
26
-
27
-
28
-
29
-
30
-
31
-
32
-
33
-
34
-
35
-
36
-
37
-
38
-
39
-
40
-
41
-
42
-
43
-
44
-
45
-
46
-
47
-
48
-
49
-
50
-
51
-
52
-
53
-
54
-
55
-
56
-
57
-
58
-
59
-
60
-
61
-
62
-
63
-
64
-
65
-
66
-
67
-
68
-
69
-
70
-
71
-
72
-
 73
73 -
 74
74 -
 75
75 -
 76
76 -
 77
77 -
 78
78 -
 79
79 -
 80
80 -
 81
81 -
 82
82 -
 83
83 -
 84
84 -
 85
85 -
 86
86 -
 87
87 -
 88
88 -
 89
89 -
 90
90 -
 91
91 -
 92
92 -
 93
93 -
94
-
95
-
96
-
97
-
98
-
99
-
100
-
101
-
102
-
103
-
104
-
105
-
106
-
107
-
108
-
109
-
110
-
111
-
112
-
113
-
114
-
115
-
116
-
117
-
118
-
119
-
120
-
121
-
122
-
123
-
124
-
125
-
126
-
127
-
128
-
129
-
130
-
131
-
132
-
133
-
134
-
135
-
136
-
137
-
138
-
139
-
140
-
141
-
142
-
143
-
144
-
145
-
146
-
147
-
148
-
149
-
150
-
151
-
152
-
153
-
154
-
155
-
156
-
157
-
158
-
159
-
160
-
161
-
162
-
163
-
164
-
165
-
166
-
167
-
168
-
169
-
170
-
171
-
172
-
173
-
174
-
175
-
176
-
177
-
178
-
179
-
180
-
181
-
182
-
183
-
184
-
185
-
186
-
187
-
188
-
189
-
190
-
191
-
192
-
193
-
194
-
195
-
196
-
197
-
198
-
199
-
200
-
201
-
202
-
203
-
204
-
205
-
206
-
207
-
208
-
209
-
210
-
211
-
212
-
213
-
214
-
215
-
216
-
217
-
218
-
219
-
220
-
221
-
222
-
223
-
224
-
225
-
226
-
227
-
228
-
229
-
230
-
231
-
232
-
233
-
234
-
235
-
236
-
237
-
238
-
239
-
240
-
241
-
242
-
243
-
244
-
245
-
246
-
247
-
248
-
249
-
250
-
251
-
252
-
253
-
254
-
255
-
256
-
257
-
258
-
259
-
260
-
261
-
262
-
263
-
264
-
265
-
266
-
267
-
268
-
269
-
270
-
271
-
272
-
273
-
274
-
275
-
276
-
277
-
278
-
279
-
280
-
281
-
282
-
283
-
284
-
285
-
286
-
287
-
288
-
289
-
290
-
291
-
292
-
293
-
294
-
295
-
296
-
297
-
298
-
299
-
300
-
301
-
302
-
303
-
304
-
305
-
306
-
307
-
308
-
309
-
310
-
311
-
312
-
313
-
314
-
315
-
316
-
317
-
318
-
319
-
320
-
321
-
322
-
323
-
324
-
325
-
326
-
327
-
328
-
329
 |
 |

81
compared to 2001 and at 31 December 2001 funds
under management stood at US$9.0 billion (US$3.9
billion of which arose from the acquisition of CCF
Brasil). In total, funds under management by our
Brazilian operations now rank fifth largest in Brazil.
Life insurance premia grew by 24 per cent and now
represent 36 per cent (34 per cent in 2000) of total
insurance premia. In Argentina, fee income was
US$30 million, or 32.6 per cent, higher than in 2000.
Initiatives taken to improve revenue mix were
reflected in higher levels of fees from credit cards
and asset management. In addition, fee income
reflected fees earned from being an arranger and
market-maker for Argentine government bond
auctions.
The increased contribution from fee income was
partly offset by lower levels of dealing profits.
Brazil’s dealing profits of US$20 million were US$7
million lower than in 2000 as losses were incurred on
interest rate trading positions as interest rates rose.
These losses were only partly offset by higher levels
of dealing profits on foreign exchange and debt
securities trading. Argentina reported dealing losses
of US$6 million compared to dealing profits of
US$16 million in 2000. This resulted from difficult
trading conditions as a result of volatility in foreign
exchange rates and losses on bond positions.
HSBC’s Argentine pensions, healthcare and life
insurance businesses also reported falls in income as
rising unemployment and collapsing economic
conditions led to a 6 per cent fall in healthcare
membership, reduced contributions to pensions funds
and a reduction in annuities business.
Operating expenses, excluding goodwill
amortisation, of US$1,497 million were US$133
million, or 10 per cent, higher than 2000. In Brazil
operating expenses of US$1,023 million, were higher
by US$141 million reflecting the acquisition of CCF
Brasil and restructuring provisions. As economic
conditions became less certain cost controls were put
in place to restrain operating expense growth with a
number of contracts renegotiated. Investment in
electronic distribution channels continued and HSBC
Bank Brasil’s internet and wireless banking services
expanded with a twofold increase in the number of
registered Internet Bank users since December 2000,
to 420,000 performing on average 1.9 million on-line
transactions a month. The newer Wireless Services,
which encompass e-mail, Cellular and Palm
Banking, have 24,000 users, a 40 per cent increase
since June 2001. In Argentina, cost controls were
rigorously enforced and the increase in operating
expenses of US$11 million was due mainly to the
write-down to market value of certain properties now
considered to be permanently impaired.
Provisions for bad and doubtful debts of US$927
million increased by US$765 million compared to
2000. In Brazil, the significant increase in
provisioning requirements of US$80 million
reflected a change in the lending portfolio mix.
Targeted growth in the high margin personal lending
portfolio led to an expected and corresponding
increase in delinquencies and provisioning levels
rose to reflect the underlying risks within the
consumer portfolio. In Argentina, provisions for bad
and doubtful debts rose substantially to reflect the
disastrous economic conditions and financial
uncertainties. This is reflected in the US$681 million
increase in the bad and doubtful debt provisions to
US$737 million compared to US$56 million in 2000.
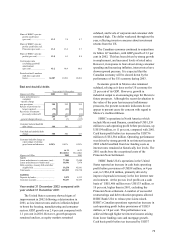
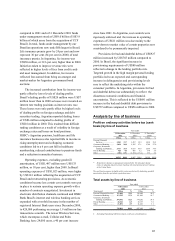
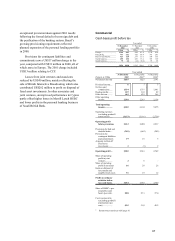
Analysis by line of business
Profit on ordinary activities before tax (cash
basis) by line of business
Year ended
31 December
2002
31 December
2001*
31 December
2000*
US$m % US$m % US$m %
Personal Financial
Services ........................ 3,543 33.7 3,457 39.3 3,010 29.2
Commercial Banking.......... 3,034 28.8 2,385 27.1 2,780 27.0
Corporate, Investment
Banking and Markets.... 3,717 35.4 4,033 45.8 3,559 34.6
Private Banking.................. 420 4.0 456 5.2 578 5.6
Other ................................ (201 ) (1.9) (1,524 ) (17.4 ) 373 3.6
10,513 100.0 8,807 100.0 10,300 100.0
* Restated for changes in management responsibility. The principal change
relates to aligning domestic private banking with international private banking
in the United States.
The cash basis measures included in this section are derived by deducting goodwill
amortisation from the equivalent reported measure.
Total assets by line of business
Year ended
31 December
2002
31 December
2001
Total assets# US$m % US$m %
Personal Financial Services. 171,496 22.9 138,908 20.2
Commercial Banking........... 113,525 15.1 101,002 14.7
Corporate, Investment
Banking and Markets..... 394,542 52.6 374,282 54.4
Private Banking................... 48,346 6.5 52,135 7.6
Other ................................. 21,892 2.9 21,281 3.1
749,801 100.0 687,608 100.0
#Excluding Hong Kong SAR Government certificates of indebtedness.