HSBC 2002 Annual Report Download - page 273
Download and view the complete annual report
Please find page 273 of the 2002 HSBC annual report below. You can navigate through the pages in the report by either clicking on the pages listed below, or by using the keyword search tool below to find specific information within the annual report.-
 1
1 -
2
-
3
-
4
-
5
-
6
-
7
-
8
-
9
-
10
-
11
-
12
-
13
-
14
-
15
-
16
-
17
-
18
-
19
-
20
-
21
-
22
-
23
-
24
-
25
-
26
-
27
-
28
-
29
-
30
-
31
-
32
-
33
-
34
-
35
-
36
-
37
-
38
-
39
-
40
-
41
-
42
-
43
-
44
-
45
-
46
-
47
-
48
-
49
-
50
-
51
-
52
-
53
-
54
-
55
-
56
-
57
-
58
-
59
-
60
-
61
-
62
-
63
-
64
-
65
-
66
-
67
-
68
-
69
-
70
-
71
-
72
-
73
-
74
-
75
-
76
-
77
-
78
-
79
-
80
-
81
-
82
-
83
-
84
-
85
-
86
-
87
-
88
-
89
-
90
-
91
-
92
-
93
-
94
-
95
-
96
-
97
-
98
-
99
-
100
-
101
-
102
-
103
-
104
-
105
-
106
-
107
-
108
-
109
-
110
-
111
-
112
-
113
-
114
-
115
-
116
-
117
-
118
-
119
-
120
-
121
-
122
-
123
-
124
-
125
-
126
-
127
-
128
-
129
-
130
-
131
-
132
-
133
-
134
-
135
-
136
-
137
-
138
-
139
-
140
-
141
-
142
-
143
-
144
-
145
-
146
-
147
-
148
-
149
-
150
-
151
-
152
-
153
-
154
-
155
-
156
-
157
-
158
-
159
-
160
-
161
-
162
-
163
-
164
-
165
-
166
-
167
-
168
-
169
-
170
-
171
-
172
-
173
-
174
-
175
-
176
-
177
-
178
-
179
-
180
-
181
-
182
-
183
-
184
-
185
-
186
-
187
-
188
-
189
-
190
-
191
-
192
-
193
-
194
-
195
-
196
-
197
-
198
-
199
-
200
-
201
-
202
-
203
-
204
-
205
-
206
-
207
-
208
-
209
-
210
-
211
-
212
-
213
-
214
-
215
-
216
-
217
-
218
-
219
-
220
-
221
-
222
-
223
-
224
-
225
-
226
-
227
-
228
-
229
-
230
-
231
-
232
-
233
-
234
-
235
-
236
-
237
-
238
-
239
-
240
-
241
-
242
-
243
-
244
-
245
-
246
-
247
-
248
-
249
-
250
-
251
-
252
-
253
-
254
-
255
-
256
-
257
-
258
-
259
-
260
-
261
-
262
-
 263
263 -
 264
264 -
 265
265 -
 266
266 -
 267
267 -
 268
268 -
 269
269 -
 270
270 -
 271
271 -
 272
272 -
 273
273 -
 274
274 -
 275
275 -
 276
276 -
 277
277 -
 278
278 -
 279
279 -
 280
280 -
 281
281 -
 282
282 -
 283
283 -
284
-
285
-
286
-
287
-
288
-
289
-
290
-
291
-
292
-
293
-
294
-
295
-
296
-
297
-
298
-
299
-
300
-
301
-
302
-
303
-
304
-
305
-
306
-
307
-
308
-
309
-
310
-
311
-
312
-
313
-
314
-
315
-
316
-
317
-
318
-
319
-
320
-
321
-
322
-
323
-
324
-
325
-
326
-
327
-
328
-
329
 |
 |

271
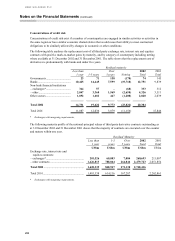
(c) Assets and liabilities denominated in foreign currency
2002 2001*
US$m US$m
Denominated in US dollars................................................................................. 250,352 260,340
Denominated in currencies other than US dollars............................................... 508,894 435,905
Total assets.......................................................................................................... 759,246 696,245
Denominated in US dollars................................................................................. 238,090 276,672
Denominated in currencies other than US dollars............................................... 521,156 419,573
Total liabilities .................................................................................................... 759,246 696,245
* Figures for 2001 have been restated to reflect the adoption of UK Financial Reporting Standard 19 ‘Deferred Tax’, details of
which are set out in Note 1 of the Financial Statements on pages 195 to 197.
(d) Structural currency exposures
HSBC’ s structural foreign currency exposure is represented by the net asset value of its foreign currency equity
and subordinated debt investments in subsidiary undertakings, branches, joint ventures and associates. Gains or
losses on structural foreign currency exposures are taken to reserves.
HSBC’ s management of structural foreign currency exposures is discussed in the ‘Financial Review’ section on
pages 137 and 138.
HSBC’ s structural currency exposures as at the year-end were as follows:
2002
Currency of structural exposure
Net investments
in overseas
operations
Borrowings taken out in the
functional currencies of the
overseas operations in orde
r
to hedge the net investments
in such operations
R
emaining
s
tructura
l
currency
exposures
US$m US$m US$m
Euros ..................................................................................... 15,090
–
15,090
Sterling.................................................................................. 10,903
–
10,903
Hong Kong dollars ................................................................ 10,172
–
10,172
Mexican pesos....................................................................... 1,998
–
1,998
Swiss francs .......................................................................... 1,794 (661 ) 1,133
Canadian dollars.................................................................... 1,008
–
1,008
Brazilian reais ....................................................................... 605
–
605
Malaysian ringgit .................................................................. 537
–
537
UAE dirham .......................................................................... 495
–
495
Singapore dollars................................................................... 462
–
462
Turkish lira............................................................................ 441
–
441
Saudi riyals............................................................................ 423
–
423
Australian dollars .................................................................. 381
–
381
Indian rupees ......................................................................... 300
–
300
Korean won........................................................................... 269
–
269
Chilean pesos ........................................................................ 226
–
226
Maltese lira............................................................................ 196
–
196
Taiwanese dollars.................................................................. 195
–
195
Egyptian pounds.................................................................... 178
–
178
Thai baht ............................................................................... 159
–
159
Cyprus pounds....................................................................... 125
–
125
Philippine pesos .................................................................... 118
–
118
Argentine pesos*................................................................... (323)
–
(323)
Others, less than US$100 million.......................................... 320
–
320
Total...................................................................................... 46,072 (661) 45,411
* The negative net investment in Argentine pesos reflects the deficiency in domestic net assets following the pesification of
certain balances formerly denominated in US dollars.