HSBC 2002 Annual Report Download - page 265
Download and view the complete annual report
Please find page 265 of the 2002 HSBC annual report below. You can navigate through the pages in the report by either clicking on the pages listed below, or by using the keyword search tool below to find specific information within the annual report.-
 1
1 -
2
-
3
-
4
-
5
-
6
-
7
-
8
-
9
-
10
-
11
-
12
-
13
-
14
-
15
-
16
-
17
-
18
-
19
-
20
-
21
-
22
-
23
-
24
-
25
-
26
-
27
-
28
-
29
-
30
-
31
-
32
-
33
-
34
-
35
-
36
-
37
-
38
-
39
-
40
-
41
-
42
-
43
-
44
-
45
-
46
-
47
-
48
-
49
-
50
-
51
-
52
-
53
-
54
-
55
-
56
-
57
-
58
-
59
-
60
-
61
-
62
-
63
-
64
-
65
-
66
-
67
-
68
-
69
-
70
-
71
-
72
-
73
-
74
-
75
-
76
-
77
-
78
-
79
-
80
-
81
-
82
-
83
-
84
-
85
-
86
-
87
-
88
-
89
-
90
-
91
-
92
-
93
-
94
-
95
-
96
-
97
-
98
-
99
-
100
-
101
-
102
-
103
-
104
-
105
-
106
-
107
-
108
-
109
-
110
-
111
-
112
-
113
-
114
-
115
-
116
-
117
-
118
-
119
-
120
-
121
-
122
-
123
-
124
-
125
-
126
-
127
-
128
-
129
-
130
-
131
-
132
-
133
-
134
-
135
-
136
-
137
-
138
-
139
-
140
-
141
-
142
-
143
-
144
-
145
-
146
-
147
-
148
-
149
-
150
-
151
-
152
-
153
-
154
-
155
-
156
-
157
-
158
-
159
-
160
-
161
-
162
-
163
-
164
-
165
-
166
-
167
-
168
-
169
-
170
-
171
-
172
-
173
-
174
-
175
-
176
-
177
-
178
-
179
-
180
-
181
-
182
-
183
-
184
-
185
-
186
-
187
-
188
-
189
-
190
-
191
-
192
-
193
-
194
-
195
-
196
-
197
-
198
-
199
-
200
-
201
-
202
-
203
-
204
-
205
-
206
-
207
-
208
-
209
-
210
-
211
-
212
-
213
-
214
-
215
-
216
-
217
-
218
-
219
-
220
-
221
-
222
-
223
-
224
-
225
-
226
-
227
-
228
-
229
-
230
-
231
-
232
-
233
-
234
-
235
-
236
-
237
-
238
-
239
-
240
-
241
-
242
-
243
-
244
-
245
-
246
-
247
-
248
-
249
-
250
-
251
-
252
-
253
-
254
-
 255
255 -
 256
256 -
 257
257 -
 258
258 -
 259
259 -
 260
260 -
 261
261 -
 262
262 -
 263
263 -
 264
264 -
 265
265 -
 266
266 -
 267
267 -
 268
268 -
 269
269 -
 270
270 -
 271
271 -
 272
272 -
 273
273 -
 274
274 -
 275
275 -
276
-
277
-
278
-
279
-
280
-
281
-
282
-
283
-
284
-
285
-
286
-
287
-
288
-
289
-
290
-
291
-
292
-
293
-
294
-
295
-
296
-
297
-
298
-
299
-
300
-
301
-
302
-
303
-
304
-
305
-
306
-
307
-
308
-
309
-
310
-
311
-
312
-
313
-
314
-
315
-
316
-
317
-
318
-
319
-
320
-
321
-
322
-
323
-
324
-
325
-
326
-
327
-
328
-
329
 |
 |

263
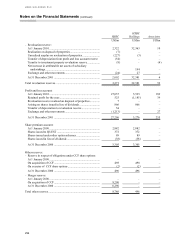
(b) Other financial instruments
(i) Financial instruments held for trading purposes
2002 2001
Mark-to-
market
values
Mark-to-
market
values
US$m US$m
Assets:
Treasury bills and other eligible bills........................................................... 5,239 5,069
Loans and advances to banks and customers ............................................... 33,829 38,242
Debt securities ............................................................................................. 67,805 67,313
Equity shares................................................................................................ 3,380 3,302
110,253 113,926
Liabilities:
Short positions in securities ......................................................................... 22,306 31,937
Debt securities in issue ................................................................................ 5,038 578
Deposits by banks and customer accounts................................................... 34,549 32,432
61,893 64,947
The net trading assets above are funded by liabilities whose fair value is not materially different from their
carrying value.
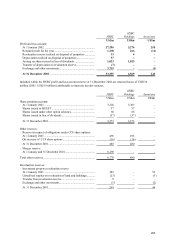
(ii) Financial instruments not held for trading purposes and for which a liquid and active market exists
2002 2001
Carryin
g
value
Mark-to-
market
values Carryin
g
value
Mark-to-
market
values
US$m US$m US$m US$m
Assets:
Treasury bills and other eligible bills.. 12,900 12,909 12,890 12,901
Debt securities .................................... 107,836 109,839 92,944 94,145
Equity shares....................................... 4,833 5,239 4,755 5,295
125,569 127,987 110,589 112,341
Liabilities:
Debt securities in issue ....................... 14,580 14,877 24,973 25,115
Subordinated liabilities ....................... 16,411 17,598 14,410 14,828
Non-equity minority interests ............. 4,431 4,420 4,160 4,134
35,422 36,895 43,543 44,077
Where possible, mark-to-market values have been estimated using market prices for these financial
instruments. Where market prices are not available, values have been estimated using quoted prices for
financial instruments with similar characteristics, or otherwise using a suitable valuation technique where
practicable to do so.