LabCorp 2010 Annual Report Download - page 11
Download and view the complete annual report
Please find page 11 of the 2010 LabCorp annual report below. You can navigate through the pages in the report by either clicking on the pages listed below, or by using the keyword search tool below to find specific information within the annual report.-
 1
1 -
 2
2 -
 3
3 -
 4
4 -
 5
5 -
 6
6 -
 7
7 -
 8
8 -
 9
9 -
 10
10 -
 11
11 -
 12
12 -
 13
13 -
 14
14 -
 15
15 -
 16
16 -
 17
17 -
 18
18 -
 19
19 -
 20
20 -
 21
21 -
 22
22 -
23
-
24
-
25
-
26
-
27
-
28
-
29
-
30
-
31
-
32
-
33
-
34
-
35
-
36
-
37
-
38
-
39
-
40
-
41
-
42
-
43
-
44
-
45
-
46
-
47
-
48
-
49
-
50
-
51
-
52
 |
 |

9
LABORATORY CORPORATION OF AMERICA
Management’s Discussion and Analysis
of Financial Condition and Results of Operations
committed to reimburse UnitedHealthcare up to $200.0 for
transition costs related to developing expanded networks in
defined markets during the first three years of the agreement.
At the end of the reimbursement period, approximately $119.6
of such transition payments have been billed to the Company
by UnitedHealthcare and approximately $119.6 has been
remitted by the Company. UnitedHealthcare has indicated that
there will be no further billings. The Company is amortizing the
total transition costs over the life of the contract.
Seasonality
The majority of the Company’s testing volume is dependent on
patient visits to doctor’s offices and other providers of health
care. Volume of testing generally declines during the year-end
holiday periods and other major holidays. In addition, volume
declines due to inclement weather may reduce net revenues and
cash flows. Therefore, comparison of the results of successive
quarters may not accurately reflect trends or results for the
full year.
Results of Operations
(amounts in millions except Revenue Per Requisition info)
Years Ended December 31, 2010, 2009, and 2008
Operating results for the year ended December 31, 2010 were
negatively impacted by severe winter weather primarily in the
eastern and middle sections of the country during the first
quarter of 2010. The Company’s testing facilities were not
damaged by the severe winter weather; however, specimen
volume was negatively impacted due to patients’ inability to
visit doctors’ offices and PSCs – the sources of the majority of
testing volume. During the year ended December 31, 2010
inclement weather had an impact on the Company’s results,
reducing volumes by an estimated 0.3%, and revenue by an
estimated $23.0.
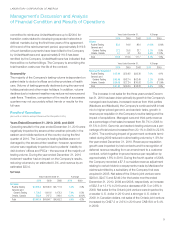
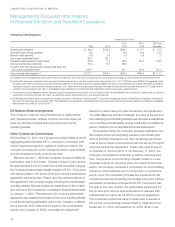
Net Sales
Years Ended December 31, % Change
2010 2009 2008 2010 2009
Net sales
Routine Testing $ 2,995.4 $ 2,845.6 $ 2,777.9 5.3% 2.4%
Genomic and
Esoteric Testing
1,728.5 1,601.6 1,478.3 7.9% 8.3%
Ontario, Canada 280.0 247.5 249.0 13.1% (0.6)%
Total $ 5,003.9 $ 4,694.7 $ 4,505.2 6.6% 4.2%
Years Ended December 31, % Change
2010 2009 2008 2010 2009
Volume
Routine Testing 83.3 84.6 86.0 (1.6)% (1.6)%
Genomic and
Esoteric Testing 27.2 25.8 23.7 5.7% 8.9%
Ontario, Canada 9.1 9.1 8.0 0.4% 12.9%
Total 119.6 119.5 117.7 0.1% 1.5%
Years Ended December 31, % Change
2010 2009 2008 2010 2009
Revenue Per Requisition
Routine Testing $ 35.96 $ 33.62 $ 32.30 7.0% 4.1%
Genomic and
Esoteric Testing $ 63.48 $ 62.14 $ 62.49 2.2% (0.6)%
Ontario, Canada $ 30.68 $ 27.24 $ 30.92 12.6% (11.9)%
Total $ 41.82 $ 39.29 $ 38.28 6.4% 2.6%
The increase in net sales for the three years ended Decem-
ber 31, 2010 has been driven primarily by growth in the Company’s
managed care business, increased revenue from third parties
(Medicare and Medicaid), the Company’s continued shift in test
mix to higher-priced genomic and esoteric tests, growth in
revenue per requisition in the Company’s routine testing and the
impact of acquisitions. Managed care and third party revenue
as a percentage of net sales increased from 59.7% in 2008 to
61.5% in 2010. Genomic and esoteric testing volume as a per-
centage of total volume increased from 20.1% in 2008 to 22.8%
in 2010. The continuing impact of government contracts termi-
nated during 2009 reduced routine testing volume by 1.8% for
the year ended December 31, 2010. Revenue per requisition
growth was impacted by lost contracts and the recognition of
deferred revenue resulting from an amendment to a customer
contract, which together improved revenue per requisition by
approximately 1.6% in 2010. During the fourth quarter of 2008,
the Company recorded a $7.5 cumulative revenue adjustment
relating to certain historic overpayments made by Medicare for
claims submitted by a subsidiary of the Company that was
acquired in 2005. Net sales of the Ontario joint venture were
$280.0, $247.5 and $249.0 for the twelve months ended
December 31, 2010, 2009 and 2008, respectively, an increase
of $32.5 or 13.1% in 2010 and a decrease of $1.5 or 0.6% in
2009. Net sales for the Ontario joint venture were impacted by
a weaker U.S. dollar in 2010 and a stronger U.S. dollar in
2009. In Canadian dollars, net sales of the Ontario joint venture
increased by CN$7.2 or 2.6% in 2010 and CN$16.9 or 6.4%
in 2009.