LabCorp 2010 Annual Report Download - page 12
Download and view the complete annual report
Please find page 12 of the 2010 LabCorp annual report below. You can navigate through the pages in the report by either clicking on the pages listed below, or by using the keyword search tool below to find specific information within the annual report.-
 1
1 -
 2
2 -
 3
3 -
 4
4 -
 5
5 -
 6
6 -
 7
7 -
 8
8 -
 9
9 -
 10
10 -
 11
11 -
 12
12 -
 13
13 -
 14
14 -
 15
15 -
 16
16 -
 17
17 -
 18
18 -
 19
19 -
 20
20 -
 21
21 -
 22
22 -
23
-
24
-
25
-
26
-
27
-
28
-
29
-
30
-
31
-
32
-
33
-
34
-
35
-
36
-
37
-
38
-
39
-
40
-
41
-
42
-
43
-
44
-
45
-
46
-
47
-
48
-
49
-
50
-
51
-
52
 |
 |

10
LABORATORY CORPORATION OF AMERICA
Management’s Discussion and Analysis
of Financial Condition and Results of Operations
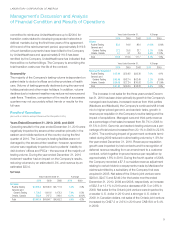
Cost of Sales
Years Ended December 31, % Change
2010 2009 2008 2010 2009
Cost of sales $ 2,906.1 $ 2,723.8 $ 2,631.4 6.7% 3.5%
Cost of sales
as a % of sales 58.1% 58.0% 58.4%
Cost of sales (primarily laboratory and distribution costs)
has increased over the three year period ended December 31,
2010 primarily due to increases in labor, growth in the Company’s
Managed Care and third party (Medicare and Medicaid) business,
the continued shift in test mix to higher cost genomic and
esoteric testing and the impact of acquisitions. As a percentage
of sales, cost of sales has decreased during the three year period
ended December 31, 2010 from 58.4% in 2008 to 58.1% in
2010. Cost of sales as a percentage of net sales was compa-
rable for 2010 and 2009. The Company’s improved efficiency
resulting from lab and PSC automation was offset by lower
margins on recently acquired operations that have not been
fully integrated into the Company’s operating cost structure as
of December 31, 2010. The percentage of cost of sales was
maintained even though the Company experienced the loss of
revenue as a result of the severe winter weather during the first
quarter of 2010. The decrease in cost of sales from 2008 to
2009 as a percentage of net sales was primarily due to operating
efficiencies and effective expense controls coupled with the
growth of revenue per requisition. Labor and testing supplies
comprise over 75% of the Company’s cost of sales.
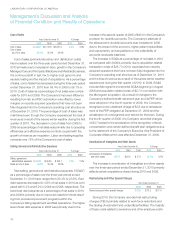
Selling, General and Adminstrative Expenses
Years Ended December 31, % Change
2010 2009 2008 2010 2009
Selling, general and
administrative expenses $ 1,034.3 $ 958.9 $ 935.1 7.9% 2.5%
SG&A as a % of sales 20.7% 20.4% 20.8%
Total selling, general and administrative expenses (“SG&A”)
as a percentage of sales over the three year period ended
December 31, 2010 have ranged from 20.4% to 20.8%. Bad
debt expense decreased to 4.8% of net sales in 2010 as com-
pared with 5.3% and 6.2% in 2009 and 2008, respectively. The
lower bad debt expense as a percentage of net sales in 2010
and 2009 is primarily due to improved collection trends result-
ing from process improvement programs within the
Company’s billing department and field operations. The higher
level of bad debt expense in 2008 was primarily due to the
increase in the second quarter of 2008 of $45.0 in the Company’s
provision for doubtful accounts. The Company’s estimate of
the allowance for doubtful accounts was increased in 2008
due to the impact of the economy, higher patient deductibles
and copayments, and acquisitions on the collectibility of
accounts receivable balances.
The increase in SG&A as a percentage of net sales in 2010
as compared with 2009 is primarily due to acquisition related
transaction costs of $25.7 in 2010, expenses from recently
acquired operations that have not been fully integrated into the
Company’s operating cost structure as of December 31, 2010
and the loss of revenue as a result of the severe winter weather
experienced during the first quarter of 2010. In 2009, SG&A
included Monogram’s incremental SG&A beginning in August
2009 and acquisition related costs of $2.7 in connection with
the Monogram acquisition. As a result of changes to the
Company’s defined benefit retirement plan and its PEP which
were adopted in the fourth quarter of 2009, the Company
recognized a net curtailment charge of $2.8 due to remeasure-
ment of the PEP obligation at December 31, 2009 and the
acceleration of unrecognized prior service for that plan. During
the fourth quarter of 2008, the Company recorded charges
of $3.7 related to the acceleration of the recognition of stock
compensation and certain defined benefit plan obligations due
to the retirement of the Company’s Executive Vice President of
Corporate Affairs which was effective December 31, 2008.
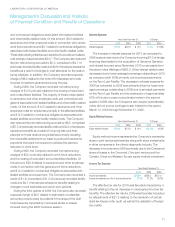
Amortization of Intangibles and Other Assets
Years Ended December 31, % Change
2010 2009 2008 2010 2009
Amortization of intangibles
and other assets $ 72.7 $ 62.6 $ 57.9 16.1% 8.1%
The increase in amortization of intangibles and other assets
over the three year period ended December 31, 2010 primarily
reflects certain acquisitions closed during 2010 and 2009.
Restructuring and Other Special Charges
Years Ended December 31,
2010 2009 2008
Restructuring and other special charges $ 12.0 $ 13.5 $ 37.9
During 2010, the Company recorded net restructuring
charges of $5.8 primarily related to work force reductions and
the closing of redundant and underutilized facilities. The majority
of these costs related to severance and other employee costs