LabCorp 2010 Annual Report Download - page 8
Download and view the complete annual report
Please find page 8 of the 2010 LabCorp annual report below. You can navigate through the pages in the report by either clicking on the pages listed below, or by using the keyword search tool below to find specific information within the annual report.-
 1
1 -
 2
2 -
 3
3 -
 4
4 -
 5
5 -
 6
6 -
 7
7 -
 8
8 -
 9
9 -
 10
10 -
 11
11 -
 12
12 -
 13
13 -
 14
14 -
 15
15 -
 16
16 -
 17
17 -
 18
18 -
 19
19 -
20
-
21
-
22
-
23
-
24
-
25
-
26
-
27
-
28
-
29
-
30
-
31
-
32
-
33
-
34
-
35
-
36
-
37
-
38
-
39
-
40
-
41
-
42
-
43
-
44
-
45
-
46
-
47
-
48
-
49
-
50
-
51
-
52
 |
 |

6
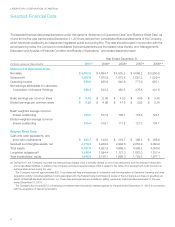
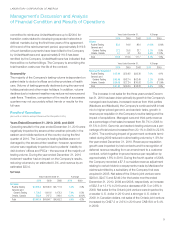
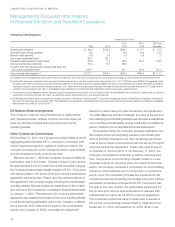
The selected financial data presented below under the captions “Statement of Operations Data” and “Balance Sheet Data” as
of and for the five-year period ended December 31, 2010 are derived from consolidated financial statements of the Company,
which have been audited by an independent registered public accounting firm. This data should be read in conjunction with the
accompanying notes, the Company’s consolidated financial statements and the related notes thereto, and “Management’s
Discussion and Analysis of Financial Condition and Results of Operations,” all included elsewhere herein.
Year Ended December 31,
(In millions, except per share amounts) 2010(a) 2009(b) 2008(c) 2007(d) 2006(e) (f)
Statement of Operations Data:
Net sales $ 5,003.9 $ 4,694.7 $ 4,505.2 $ 4,068.2 $ 3,590.8
Gross profit 2,097.8 1,970.9 1,873.8 1,691.2 1,529.4
Operating income 978.8 935.9 842.9 777.0 697.1
Net earnings attributable to Laboratory
Corporation of America Holdings 558.2 543.3 464.5 476.8 431.6
Basic earnings per common share $ 5.42 $ 5.06 $ 4.23 $ 4.08 $ 3.48
Diluted earnings per common share $ 5.29 $ 4.98 $ 4.16 $ 3.93 $ 3.24
Basic weighted average common
shares outstanding 103.0 107.4 109.7 116.8 124.1
Diluted weighted average common
shares outstanding 105.4 109.1 111.8 121.3 134.7
Balance Sheet Data:
Cash and cash equivalents, and
short-term investments $ 230.7 $ 148.5 $ 219.7 $ 166.3 $ 186.9
Goodwill and intangible assets, net 4,275.4 3,239.3 2,994.8 2,252.9 2,094.2
Total assets 6,187.8 4,837.8 4,669.5 4,368.2 4,000.8
Long-term obligations(g) 2,188.4 1,394.4 1,721.3 1,667.0 1,157.4
Total shareholders’ equity 2,466.3 2,106.1 1,688.3 1,725.3 1,977.1
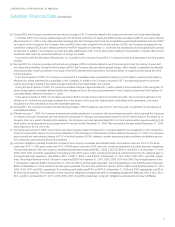
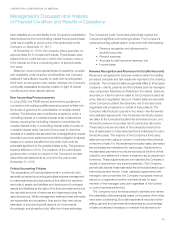
(a) During 2010, the Company recorded net restructuring charges of $5.8 primarily related to work force reductions and the closing of redundant
and underutilized facilities. In addition, the Company recorded a special charge of $6.2 related to the write-off of development costs incurred on
systems abandoned during the year.
The Company incurred approximately $25.7 in professional fees and expenses in connection with the acquisition of Genzyme Genetics and other
acquisition activity, including significant costs associated with the Federal Trade Commission’s review of the Company’s purchase of specified net
assets of Westcliff Medical Laboratories, Inc. These fees and expenses are included in selling, general and administrative expenses for the year
ended December 31, 2010.
The Company also incurred $7.0 of financing commitment fees (included in interest expense for the year ended December 31, 2010) in connection
with the acquisition of Genzyme Genetics.
LABORATORY CORPORATION OF AMERICA
Selected Financial Data