LabCorp 2010 Annual Report Download - page 46
Download and view the complete annual report
Please find page 46 of the 2010 LabCorp annual report below. You can navigate through the pages in the report by either clicking on the pages listed below, or by using the keyword search tool below to find specific information within the annual report.-
 1
1 -
2
-
3
-
4
-
5
-
6
-
7
-
8
-
9
-
10
-
11
-
12
-
13
-
14
-
15
-
16
-
17
-
18
-
19
-
20
-
21
-
22
-
23
-
24
-
25
-
26
-
27
-
28
-
29
-
30
-
31
-
32
-
33
-
34
-
35
-
 36
36 -
 37
37 -
 38
38 -
 39
39 -
 40
40 -
 41
41 -
 42
42 -
 43
43 -
 44
44 -
 45
45 -
 46
46 -
 47
47 -
 48
48 -
 49
49 -
 50
50 -
 51
51 -
 52
52
 |
 |

44
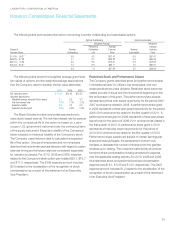
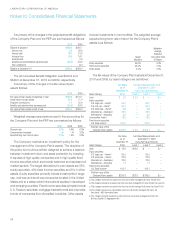
A summary of the changes in the projected benefit obligations
of the Company Plan and the PEP are summarized as follows:
2010 2009
Balance at January 1 $ 328.0 $ 292.7
Service cost
2.6 20.8
Interest cost
18.1 18.3
Actuarial loss
24.8 24.1
Amendments
– 0.9
Benefits and administrative expenses paid (25.3) (24.1)
Plan curtailment
– (4.7)
Balance at December 31 $ 348.2 $ 328.0
The Accumulated Benefit Obligation was $348.2 and
$328.0 at December 31, 2010 and 2009, respectively.
A summary of the changes in the fair value of plan
assets follows:
2010 2009
Fair value of plan assets at beginning of year $ 259.3 $ 170.1
Actual return on plan assets 29.3 57.4
Employer contributions
1.1 55.9
Benefits and administrative expenses paid (25.3) (24.1)
Fair value of plan assets at end of year $ 264.4 $ 259.3
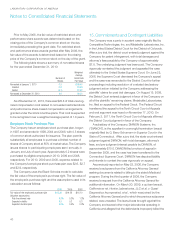
Weighted average assumptions used in the accounting for
the Company Plan and the PEP are summarized as follows:
2010 2009 2008
Discount rate 5.1% 5.8% 6.5%
Compensation increases –% –% 3.5%
Expected long term rate of return 7.5% 7.5% 8.5%
The Company maintains an investment policy for the
management of the Company Plan’s assets. The objective of
this policy is to build a portfolio designed to achieve a balance
between investment return and asset protection by investing
in equities of high quality companies and in high quality fixed
income securities which are broadly balanced and represent all
market sectors. The target allocations for plan assets are 55%
equity securities, 40% fixed income securities and 5% in other
assets. Equity securities primarily include investments in large-
cap, mid-cap and small-cap companies located in the United
States and to a lesser extent international equities in developed
and emerging countries. Fixed income securities primarily include
U.S. Treasury securities, mortgage-backed bonds and corporate
bonds of companies from diversified industries. Other assets
include investments in commodities. The weighted average
expected long-term rate of return for the Company Plan’s
assets is as follows:
Weighted-
Average
Expected
Target Long-Term Rate
Allocation of Return
Equity securities 55.0% 5.0%
Fixed income securities 40.0% 2.0%
Other assets 5.0% 0.5%
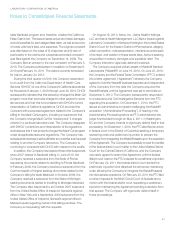
The fair values of the Company Plan’s assets at December 31,
2010 and 2009, by asset category are as follows:
Fair Value Fair Value Measurements as of
as of December 31, 2010
December 31, Using Fair Value Hierarchy
Asset Category 2010 Level 1 Level 2 Level 3
Cash $ 2.3 $ 2.3 $ – $ –
Equity securities:
U.S. large cap – blend(a)
62.7 – 62.7 –
U.S. mid cap – blend(b)
26.7 – 26.7 –
U.S. small cap – blend(c)
9.8 – 9.8 –
International – developed 37.5 – 37.5 –
International – emerging 8.2 – 8.2 –
Commodities index(d)
15.0 – 15.0 –
Fixed income securities:
U.S. fixed income(e)
102.2 – 102.2 –
Total fair value of the
Company Plan’s assets $ 264.4 $ 2.3 $ 262.1 $ –
Fair Value Fair Value Measurements as of
as of December 31, 2009
December 31, Using Fair Value Hierarchy
Asset Category 2009 Level 1 Level 2 Level 3
Cash $ 13.8 $ 13.8 $ – $ –
Equity securities:
U.S. large cap – blend(a) 80.5 – 80.5 –
U.S. small cap – blend(c) 23.3 – 23.3 –
International – developed 32.5 – 32.5 –
International – emerging 7.1 – 7.1 –
Fixed income securities:
U.S. fixed income(e) 102.1 – 102.1 –
Total fair value of the
Company Plan’s assets $ 259.3 $ 13.8 $ 245.5 $ –
a) This category represents an equity index fund not actively managed that tracks the S&P 500.
b) This category represents an equity index fund not actively managed that tracks the S&P mid-cap 400.
c) This category represents an equity index fund not actively managed that tracks the Russell 2000.
d) This category represents a commodities index fund not actively managed that tracks the
Dow Jones - UBS Commodity Index.
e) This category primarily represents a bond index fund not actively managed that tracks the
Barclays Capital U.S. Aggregate Index.
LABORATORY CORPORATION OF AMERICA
Notes to Consolidated Financial Statements