LabCorp 2011 Annual Report Download - page 11
Download and view the complete annual report
Please find page 11 of the 2011 LabCorp annual report below. You can navigate through the pages in the report by either clicking on the pages listed below, or by using the keyword search tool below to find specific information within the annual report.-
 1
1 -
 2
2 -
 3
3 -
 4
4 -
 5
5 -
 6
6 -
 7
7 -
 8
8 -
 9
9 -
 10
10 -
 11
11 -
 12
12 -
 13
13 -
 14
14 -
 15
15 -
 16
16 -
 17
17 -
 18
18 -
 19
19 -
 20
20 -
 21
21 -
 22
22 -
23
-
24
-
25
-
26
-
27
-
28
-
29
-
30
-
31
-
32
-
33
-
34
-
35
-
36
-
37
-
38
-
39
-
40
-
41
-
42
-
43
-
44
-
45
-
46
-
47
-
48
-
49
-
50
-
51
-
52
 |
 |

9
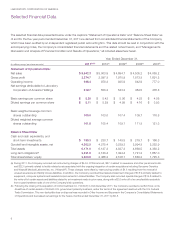
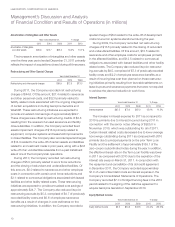
LABORATORY CORPORATION OF AMERICA
Management’s Discussion and Analysis
of Financial Condition and Results of Operations (in millions)
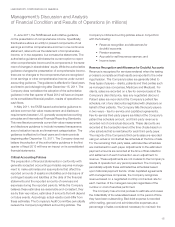
Years Ended December 31, % Change
2011 2010 2009 2011 2010
Volume
Routine Testing 85.2 83.3 84.6 2.3% (1.6)%
Genomic and
Esoteric Testing 29.3 27.2 25.8 7.8% 5.7%
Ontario, Canada 9.3 9.1 9.1 1.8% 0.4%
Total 123.8 119.6 119.5 3.5% 0.1%
Years Ended December 31, % Change
2011 2010 2009 2011 2010
Revenue Per Requisition
Routine Testing $ 36.91 $ 35.96 $ 33.62 2.6% 7.0%
Genomic and
Esoteric Testing $ 71.19 $ 63.48 $ 62.14 12.1% 2.2%
Ontario, Canada $ 33.29 $ 30.68 $ 27.24 8.5% 12.6%
Total $ 44.76 $ 41.82 $ 39.29 7.0% 6.4%
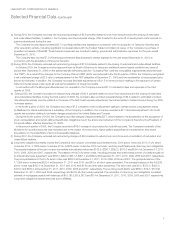
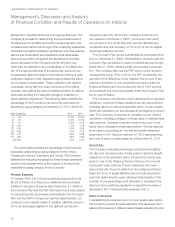
The increase in net sales for the three years ended
December 31, 2011 has been driven primarily by acquisitions
made in all years (most significantly in the second half of 2010),
along with growth in the Company’s managed care business,
increased revenue from third parties (Medicare and Medicaid),
the Company’s continued shift in test mix to higher-priced
genomic and esoteric tests, and growth in revenue per requisi-
tion in the Company’s routine testing. Managed care and third
party revenue as a percentage of net sales increased from 61.8%
in 2009 to 62.8% in 2011. Genomic and esoteric testing volume
as a percentage of total volume increased from 21.6% in 2009 to
23.7% in 2011. The continuing impact of government contracts
terminated during 2009 reduced routine testing volume by 0.1%
and 1.8% for the years ended December 31, 2011 and 2010,
respectively. Revenue per requisition growth was impacted in
2010 by lost contracts and the recognition of deferred revenue
resulting from an amendment to a customer contract, which
together improved revenue per requisition by approximately 1.6%.
In 2011, the Company’s 2010 acquisition of Genzyme Genetics
contributed 6.8% to the overall 10.8% growth in revenue and
0.9% to the overall 3.5% growth in volume. Net sales of the
Ontario joint venture were $309.4, $280.0 and $247.5 for the
twelve months ended December 31, 2011, 2010 and 2009,
respectively, an increase of $29.4 or 10.5%, and $32.5 or
13.1% in 2011 and 2010, respectively. Net sales for the Ontario
joint venture were impacted by a weaker U.S. dollar in 2011 and
a stronger U.S. dollar in 2010 and 2009. In Canadian dollars,
net sales of the Ontario joint venture for the twelve months
ended December 31, 2011, 2010 and 2009 were CN$306.0,
CN$288.5 and CN$281.3, respectively.
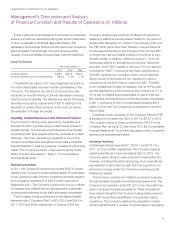
Cost of Sales
Years Ended December 31, % Change
2011 2010 2009 2011 2010
Cost of sales $ 3,267.6 $ 2,906.1 $ 2,723.8 12.4% 6.7%
Cost of sales
as a % of sales 59.0% 58.1% 58.0%
Cost of sales (primarily laboratory and distribution costs)
has increased over the three year period ended December 31,
2011 primarily due to overall growth in the Company’s volume,
as well as increases in labor, the continued shift in test mix to
higher cost genomic and esoteric testing and the impact of
acquisitions. As a percentage of sales, cost of sales has
increased during the three year period ended December 31,
2011 from 58.0% in 2009 to 59.0% in 2011. Cost of sales as
a percentage of net sales was comparable for 2010 and 2009.
The increase in 2011 cost of sales as a percentage of net sales
is primarily attributable to recent acquisitions that have not been
fully integrated into the Company’s operating cost structure as
of December 31, 2011. Labor and testing supplies comprise
over 77% of the Company’s cost of sales.
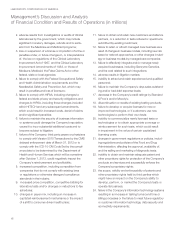
Selling, General and Administrative Expenses
Years Ended December 31, % Change
2011 2010 2009 2011 2010
Selling, general and
administrative expenses $ 1,159.6 $1,034.3 $ 958.9 12.1% 7.9%
SG&A as a % of sales 20.9% 20.7% 20.4%
Total selling, general and administrative expenses (“SG&A”)
as a percentage of sales over the three year period ended
December 31, 2011 have ranged from 20.4% to 20.9%.
Bad debt expense decreased to 4.6% of net sales in 2011
as compared with 4.8% and 5.3% in 2010 and 2009, respec-
tively. The lower bad debt expense as a percentage of net
sales in 2011 and 2010 is primarily due to improved collection
trends resulting from process improvement programs within
the Company’s billing department and field operations.
The increase in SG&A as a percentage of net sales in
2011 as compared with 2010 is primarily due to net litigation
settlement expense of $34.5 recorded in 2011. The increase
in SG&A as a percentage of net sales in 2010 as compared
to 2009 is due to acquisition related costs of $25.7 in 2010,
along with expenses from recently acquired operations that
had not been fully integrated into the Company’s operating
cost structure.