LabCorp 2011 Annual Report Download - page 25
Download and view the complete annual report
Please find page 25 of the 2011 LabCorp annual report below. You can navigate through the pages in the report by either clicking on the pages listed below, or by using the keyword search tool below to find specific information within the annual report.-
 1
1 -
2
-
3
-
4
-
5
-
6
-
7
-
8
-
9
-
10
-
11
-
12
-
13
-
14
-
 15
15 -
 16
16 -
 17
17 -
 18
18 -
 19
19 -
 20
20 -
 21
21 -
 22
22 -
 23
23 -
 24
24 -
 25
25 -
 26
26 -
 27
27 -
 28
28 -
 29
29 -
 30
30 -
 31
31 -
 32
32 -
 33
33 -
 34
34 -
 35
35 -
36
-
37
-
38
-
39
-
40
-
41
-
42
-
43
-
44
-
45
-
46
-
47
-
48
-
49
-
50
-
51
-
52
 |
 |

23
LABORATORY CORPORATION OF AMERICA
Management’s Discussion and Analysis
of Financial Condition and Results of Operations (in millions)
23
LABORATORY CORPORATION OF AMERICA
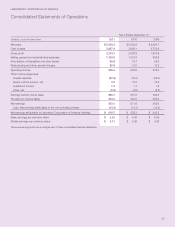
Consolidated Statements of Operations
Years Ended December 31,
(In Millions, Except Per Share Data) 2011 2010 2009
Net sales $ 5,542.3 $ 5,003.9 $ 4,694.7
Cost of sales 3,267.6 2,906.1 2,723.8
Gross profit 2,274.7 2,097.8 1,970.9
Selling, general and administrative expenses 1,159.6 1,034.3 958.9
Amortization of intangibles and other assets 85.8 72.7 62.6
Restructuring and other special charges 80.9 12.0 13.5
Operating income 948.4 978.8 935.9
Other income (expenses):
Interest expense (87.5) (70.0) (62.9)
Equity method income, net 9.5 10.6 13.8
Investment income 1.3 1.1 1.6
Other, net (5.6) (4.9) (3.8)
Earnings before income taxes 866.1 915.6 884.6
Provision for income taxes 333.0 344.0 329.0
Net earnings 533.1 571.6 555.6
Less: Net earnings attributable to the noncontrolling interest (13.4) (13.4) (12.3)
Net earnings attributable to Laboratory Corporation of America Holdings $ 519.7 $ 558.2 $ 543.3
Basic earnings per common share $ 5.20 $ 5.42 $ 5.06
Diluted earnings per common share $ 5.11 $ 5.29 $ 4.98
The accompanying notes are an integral part of these consolidated financial statements.