LabCorp 2011 Annual Report Download - page 8
Download and view the complete annual report
Please find page 8 of the 2011 LabCorp annual report below. You can navigate through the pages in the report by either clicking on the pages listed below, or by using the keyword search tool below to find specific information within the annual report.-
 1
1 -
 2
2 -
 3
3 -
 4
4 -
 5
5 -
 6
6 -
 7
7 -
 8
8 -
 9
9 -
 10
10 -
 11
11 -
 12
12 -
 13
13 -
 14
14 -
 15
15 -
 16
16 -
 17
17 -
 18
18 -
 19
19 -
20
-
21
-
22
-
23
-
24
-
25
-
26
-
27
-
28
-
29
-
30
-
31
-
32
-
33
-
34
-
35
-
36
-
37
-
38
-
39
-
40
-
41
-
42
-
43
-
44
-
45
-
46
-
47
-
48
-
49
-
50
-
51
-
52
 |
 |

6
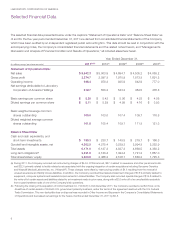
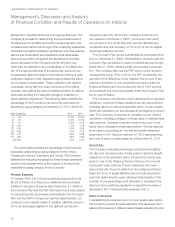
The selected financial data presented below under the captions “Statement of Operations Data” and “Balance Sheet Data” as
of and for the five-year period ended December 31, 2011 are derived from consolidated financial statements of the Company,
which have been audited by an independent registered public accounting firm. This data should be read in conjunction with the
accompanying notes, the Company’s consolidated financial statements and the related notes thereto, and “Management’s
Discussion and Analysis of Financial Condition and Results of Operations,” all included elsewhere herein.
Year Ended December 31,
(In millions, except per share amounts) 2011(a) (b) 2010(c) 2009(d) 2008(e) 2007(f)
Statement of Operations Data:
Net sales $ 5,542.3 $ 5,003.9 $ 4,694.7 $ 4,505.2 $ 4,068.2
Gross profit 2,274.7 2,097.8 1,970.9 1,873.8 1,691.2
Operating income 948.4 978.8 935.9 842.9 777.0
Net earnings attributable to Laboratory
Corporation of America Holdings 519.7 558.2 543.3 464.5 476.8
Basic earnings per common share $ 5.20 $ 5.42 $ 5.06 $ 4.23 $ 4.08
Diluted earnings per common share $ 5.11 $ 5.29 $ 4.98 $ 4.16 $ 3.93
Basic weighted average common
shares outstanding 100.0 103.0 107.4 109.7 116.8
Diluted weighted average common
shares outstanding 101.8 105.4 109.1 111.8 121.3
Balance Sheet Data:
Cash and cash equivalents, and
short-term investments $ 159.3 $ 230.7 $ 148.5 $ 219.7 $ 166.3
Goodwill and intangible assets, net 4,302.5 4,275.4 3,239.3 2,994.8 2,252.9
Total assets 6,171.0 6,187.8 4,837.8 4,669.5 4,368.2
Long-term obligations(g)
2,221.0 2,188.4 1,394.4 1,721.3 1,667.0
Total shareholders’ equity 2,503.5 2,466.3 2,106.1 1,688.3 1,725.3
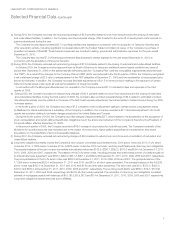
(a) During 2011, the Company recorded net restructuring charges of $44.6. Of this amount, $27.4 related to severance and other personnel costs,
and $22.0 primarily related to facility-related costs associated with the ongoing integration of certain acquisitions including Genzyme Genetics
and Westcliff Medical Laboratories, Inc. (“Westcliff”). These charges were offset by restructuring credits of $4.8 resulting from the reversal of
unused severance and facility closure liabilities. In addition, the Company recorded fixed assets impairment charges of $18.9 primarily related to
equipment, computer systems and leasehold improvements in closed facilities. The Company also recorded special charges of $14.8 related to
the write-off of certain assets and liabilities related to an investment made in prior years, along with a $2.6 write-off of an uncollectible receivable
from a past installment sale of one of the Company’s lab operations.
(b) Following the closing of its acquisition of Orchid Cellmark Inc. (“Orchid”) in mid-December 2011, the Company recorded a net $2.8 loss on its
divestiture of certain assets of Orchid’s U.S. government paternity business, under the terms of the agreement reached with the U.S. Federal
Trade Commission. This non-deductible loss on disposal was recorded in Other Income and Expense in the Company’s Consolidated Statements
of Operations and decreased net earnings for the twelve months ended December 31, 2011 by $2.8.
LABORATORY CORPORATION OF AMERICA
Selected Financial Data