LabCorp 2011 Annual Report Download - page 46
Download and view the complete annual report
Please find page 46 of the 2011 LabCorp annual report below. You can navigate through the pages in the report by either clicking on the pages listed below, or by using the keyword search tool below to find specific information within the annual report.-
 1
1 -
2
-
3
-
4
-
5
-
6
-
7
-
8
-
9
-
10
-
11
-
12
-
13
-
14
-
15
-
16
-
17
-
18
-
19
-
20
-
21
-
22
-
23
-
24
-
25
-
26
-
27
-
28
-
29
-
30
-
31
-
32
-
33
-
34
-
35
-
 36
36 -
 37
37 -
 38
38 -
 39
39 -
 40
40 -
 41
41 -
 42
42 -
 43
43 -
 44
44 -
 45
45 -
 46
46 -
 47
47 -
 48
48 -
 49
49 -
 50
50 -
 51
51 -
 52
52
 |
 |

44
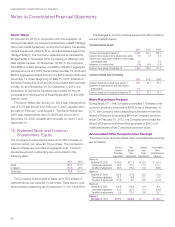
In addition, the Company Plan covers substantially all
employees hired prior to December 31, 2009. The benefits
to be paid under the Company Plan are based on years of
credited service through December 31, 2009, interest credits
and average compensation. The Company’s policy is to fund
the Company Plan with at least the minimum amount required
by applicable regulations. The Company made contributions
to the Company Plan of $0.0, $0.0 and $54.8 in 2011, 2010
and 2009, respectively.
The PEP covers the Company’s senior management
group. Prior to 2010, the PEP provided for the payment of
the difference, if any, between the amount of any maximum
limitation on annual benefit payments under the Employee
Retirement Income Security Act of 1974 and the annual
benefit that would be payable under the Company Plan but
for such limitation. Effective January 1, 2010, employees
participating in the PEP no longer earn service-based credits.
The PEP is an unfunded plan.
As a result of the changes to the Company Plan and
PEP which were adopted in the fourth quarter of 2009, the
Company recognized a net curtailment charge of $2.8 due to
remeasurement of the PEP obligation at December 31, 2009
and the acceleration of unrecognized prior service for that plan.
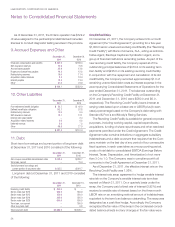
Projected pension expense for the Company Plan and the
PEP is expected to increase from $8.6 in 2011 to $12.2 in
2012. The Company plans to make contributions of $14.6 to
the Company Plan during 2012.
The effect on operations for both the Company Plan and
the PEP are summarized as follows:
Year ended December 31,
2011 2010 2009
Service cost for benefits earned $ 2.6 $ 2.6 $ 20.8
Interest cost on benefit obligation 17.1 18.1 18.3
Expected return on plan assets (18.9) (18.5) (17.3)
Net amortization and deferral 7.8 7.4 12.0
Curtailment cost – – 2.8
Defined benefit plan costs $ 8.6 $ 9.6 $ 36.6
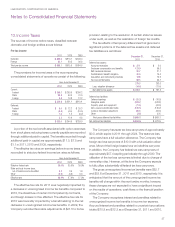
Amounts included in accumulated other comprehensive
earnings consist of unamortized net loss of $156.9. The
accumulated other comprehensive earnings that are expected
to be recognized as components of the defined benefit plan
costs during 2012 are $12.3 related to amortization of net loss.
A summary of the changes in the projected benefit obligations
of the Company Plan and the PEP are summarized as follows:
2011 2010
Balance at January 1 $ 348.2 $ 328.0
Service cost
2.6 2.6
Interest cost
17.1 18.1
Actuarial loss
39.8 24.8
Benefits and administrative expenses paid (24.5) (25.3)
Balance at December 31 $ 383.2 $ 348.2
The Accumulated Benefit Obligation was $383.2 and
$348.2 at December 31, 2011 and 2010, respectively.
A summary of the changes in the fair value of plan
assets follows:
2011 2010
Fair value of plan assets at beginning of year $ 264.4 $ 259.3
Actual return on plan assets 3.5 29.3
Employer contributions
1.1 1.1
Benefits and administrative expenses paid (24.5) (25.3)
Fair value of plan assets at end of year $ 244.5 $ 264.4
Weighted average assumptions used in the accounting for
the Company Plan and the PEP are summarized as follows:
2011 2010 2009
Discount rate 4.0% 5.1% 5.8%
Compensation increases – – –%
Expected long term rate of return 7.3% 7.5% 7.5%
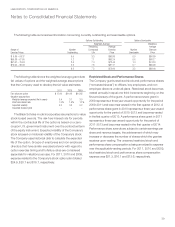
The Company maintains an investment policy for the
management of the Company Plan’s assets. The objective of
this policy is to build a portfolio designed to achieve a balance
between investment return and asset protection by investing
in equities of high quality companies and in high quality fixed
income securities which are broadly balanced and represent
all market sectors. The target allocations for plan assets are
50% equity securities, 45% fixed income securities and 5% in
other assets. Equity securities primarily include investments in
large-cap, mid-cap and small-cap companies located in the
United States and to a lesser extent international equities in
developed and emerging countries. Fixed income securities
primarily include U.S. Treasury securities, mortgage-backed
bonds and corporate bonds of companies from diversified
industries. Other assets include investments in commodities.
LABORATORY CORPORATION OF AMERICA
Notes to Consolidated Financial Statements