LabCorp 2012 Annual Report Download - page 11
Download and view the complete annual report
Please find page 11 of the 2012 LabCorp annual report below. You can navigate through the pages in the report by either clicking on the pages listed below, or by using the keyword search tool below to find specific information within the annual report.-
 1
1 -
 2
2 -
 3
3 -
 4
4 -
 5
5 -
 6
6 -
 7
7 -
 8
8 -
 9
9 -
 10
10 -
 11
11 -
 12
12 -
 13
13 -
 14
14 -
 15
15 -
 16
16 -
 17
17 -
 18
18 -
 19
19 -
 20
20 -
 21
21 -
 22
22 -
23
-
24
-
25
-
26
-
27
-
28
-
29
-
30
-
31
-
32
-
33
-
34
-
35
-
36
-
37
-
38
-
39
-
40
-
41
-
42
-
43
-
44
-
45
-
46
-
47
-
48
-
49
-
50
-
51
-
52
-
53
-
54
 |
 |

9
LABORATORY CORPORATION OF AMERICA
Management’s Discussion and Analysis
of Financial Condition and Results of Operations (in millions)
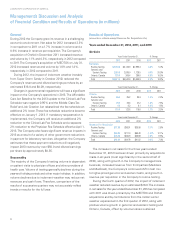
in the fourth quarter of 2012 due to Super Storm Sandy.
Genomic and esoteric testing volume as a percentage of
total volume was 23.7% in both 2012 and 2011. Volume
growth for genomic and esoteric testing was primarily due
to the incremental volume from Orchid as well as growth in
the NuSwab® series of women’s health tests, offset by
declines in histology and surgical pathology volumes. The
decline in price in genomic and esoteric testing is a result of
a lower mix of reproductive and histology testing. Net sales
of the Ontario subsidiary were $335.0 for 2012 compared to
$309.4 in 2011, an increase of $25.6, or 8.3%. Net sales of the
Ontario subsidiary were negatively impacted by a stronger
U.S. dollar in 2012 as compared with 2011 and a weaker
dollar in 2011 compared to 2010. In Canadian dollars, net
sales of the Ontario subsidiary for the twelve months ended
December 31, 2012, 2011 and 2010 were CN$334.7, CN$306.0
and CN$288.5, respectively.
In 2011, the Company’s 2010 acquisition of Genzyme
Genetics contributed 6.8% to the overall 10.8% growth in
revenue and 0.9% to the overall 3.5% growth in volume.
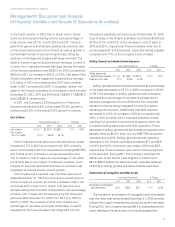
Cost of Sales
Years Ended December 31, % Change
2012 2011 2010 2012 2011
Cost of sales $ 3,421.7 $ 3,267.6 $ 2,906.1 4.7% 12.4%
Cost of sales
as a % of sales 60.3% 59.0% 58.1%
Cost of sales (primarily laboratory and distribution costs)
increased 4.7% in 2012 as compared with 2011 primarily
due to incremental costs from acquisitions including MEDTOX
and Orchid and to increases in employee benefits cost.
The increase in cost of sales as a percentage of net sales
is primarily due to the impact of inclement weather, lower
margins on acquired operations that have not yet been fully
integrated as well as slower volume growth.
Cost of sales has increased over the three-year period
ended December 31, 2012 primarily due to overall growth
in the Company’s volume, as well as increases in labor, the
continued shift in test mix to higher cost genomic and
esoteric testing and the impact of acquisitions. As a percentage
of sales, cost of sales has increased during the three-year
period ended December 31, 2012 from 58.1% in 2010 to
60.3% in 2012. The increase in 2012 cost of sales as a
percentage of net sales is primarily attributable to recent
acquisitions that have not been fully integrated into the
Company’s operating cost structure as of December 31, 2012.
Cost of sales of the Ontario subsidiary contributed $16.8 and
$17.4 or 0.5% and 0.6% of the increase in cost of sales in
2012 and 2011, respectively. These increases were due to
continued growth in the business. Labor and testing supplies
comprise over 77% of the Company’s cost of sales.
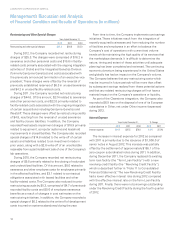
Selling, General and Administrative Expenses
Years Ended December 31, % Change
2012 2011 2010 2012 2011
Selling, general and
administrative expenses $ 1,114.6 $ 1,159.6 $ 1,034.3 (3.9)% 12.1%
SG&A as a % of sales 19.7% 20.9% 20.7%
Selling, general and administrative expenses as a percentage
of net sales decreased to 19.7% in 2012 compared to 20.9%
in 2011. The decrease in selling, general and administrative
expenses as a percentage of net sales is partially due to
expense management and to efficiencies from acquired
operations that are being integrated into the Company’s
operating cost structure. Additionally, bad debt expense
decreased to 4.3% of net sales in 2012 as compared with
4.6% in 2011 primarily due to improved collection trends
resulting from process improvement programs within the
Company’s billing department and field operations. These
decreases in selling, general and administrative expenses were
partially offset by $9.9 in fees from the MEDTOX acquisition
recorded during 2012. Selling, general and administrative
expenses of the Ontario subsidiary increased $7.1 and $6.6
or 0.6% and 0.6% of the prior year totals in 2012 and 2011,
respectively. These increases were due to continued growth
in the business. During 2011, the Company recorded the
settlement of the Hunter Labs litigation in California for
$34.5 ($49.5 settlement less previously recorded reserves
of $15.0) in selling, general and administrative expenses.
Amortization of Intangibles and Other Assets
Years Ended December 31, % Change
2012 2011 2010 2012 2011
Amortization of intangibles
and other assets $86.3 $ 85.8 $ 72.7 0.6% 18.0%
The increase in amortization of intangibles and other assets
over the three-year period ended December 31, 2012 primarily
reflects the impact of acquisitions closed during all three years.
During 2012, the Company recorded $6.2 in accelerated amorti-
zation relating to the termination of a licensing agreement.