LabCorp 2012 Annual Report Download - page 44
Download and view the complete annual report
Please find page 44 of the 2012 LabCorp annual report below. You can navigate through the pages in the report by either clicking on the pages listed below, or by using the keyword search tool below to find specific information within the annual report.-
 1
1 -
2
-
3
-
4
-
5
-
6
-
7
-
8
-
9
-
10
-
11
-
12
-
13
-
14
-
15
-
16
-
17
-
18
-
19
-
20
-
21
-
22
-
23
-
24
-
25
-
26
-
27
-
28
-
29
-
30
-
31
-
32
-
33
-
 34
34 -
 35
35 -
 36
36 -
 37
37 -
 38
38 -
 39
39 -
 40
40 -
 41
41 -
 42
42 -
 43
43 -
 44
44 -
 45
45 -
 46
46 -
 47
47 -
 48
48 -
 49
49 -
 50
50 -
 51
51 -
 52
52 -
 53
53 -
 54
54
 |
 |

42
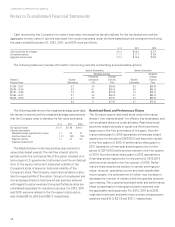
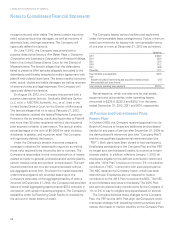
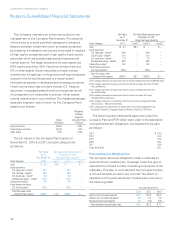
Cash received by the Company from option exercises, the actual tax benefit realized for the tax deductions and the
aggregate intrinsic value of options exercised from option exercises under all share-based payment arrangements during
the years ended December 31, 2012, 2011, and 2010 were as follows:
2012 2011 2010
Cash received by the Company $ 69.4 $ 106.1 $ 73.7
Tax benefits realized $ 9.7 $ 17.7 $ 13.0
Aggregate intrinsic value $ 25.3 $ 45.5 $ 33.4
LABORATORY CORPORATION OF AMERICA
Notes to Consolidated Financial Statements
The following table summarizes information concerning currently outstanding and exercisable options.
Options Outstanding Options Exercisable
Weighted-Average Weighted-
Remaining Average Average
Range of Number Contractual Exercise Number Exercise
Exercise Prices Outstanding Life Price Exercisable Price
$ 6.80 – 59.37 0.3 2.4 $50.50 0.3 $50.50
$59.38 – 67.60 0.8 6.1 $60.19 0.8 $60.19
$67.61 – 75.63 2.0 6.4 $72.53 1.5 $73.27
$75.64 – 80.37 0.7 4.4 $80.10 0.7 $80.15
$80.38 – 98.49 3.1 8.8 $87.52 0.4 $90.84
6.9 7.1 $77.62 3.7 $72.03
The following table shows the weighted-average grant-date
fair values of options and the weighted-average assumptions
that the Company used to develop the fair value estimates:
2012 2011 2010
Fair value per option $ 13.43 $ 17.06 $ 14.12
Valuation assumptions
Weighted-average expected life (in years) 3.4 3.4 3.1
Risk free interest rate 0.4% 1.0% 1.5%
Expected volatility 0.2 0.2 0.3
Expected dividend yield – – –
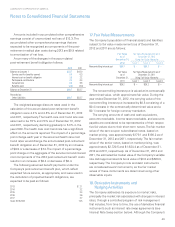
The Black-Scholes model incorporates assumptions to
value stock-based awards. The risk-free interest rate for
periods within the contractual life of the option is based on a
zero-coupon U.S. government instrument over the contractual
term of the equity instrument. Expected volatility of the
Company’s stock is based on historical volatility of the
Company’s stock. The Company uses historical data to cal cu-
late the expected life of the option. Groups of employees and
non-employee directors that have similar exercise behavior
with regard to option exercise timing and forfeiture rates are
considered separately for valuation purposes. For 2012, 2011
and 2010, expense related to the Company’s stock option
plan totaled $21.5, $24.9 and $20.7, respectively.
Restricted Stock and Performance Shares
The Company grants restricted stock and performance
shares (“non-vested shares”) to officers, key employees, and
non-employee directors under all plans. Restricted stock
becomes vested annually in equal one-third increments
beginning on the first anniversary of the grant. A perfor-
mance share grant in 2010 represents a three-year award
opportunity for the period 2010-2012 and becomes vested
in the first quarter of 2013. A performance share grant in
2011 represents a three-year award opportunity for the
period of 2011-2013 and becomes vested in the first quarter
of 2014. A performance share grant in 2012 represents a
three-year award opportunity for the period of 2012-2014
and becomes vested in the first quarter of 2015. Perfor-
mance share awards are subject to certain earnings per
share, revenue, operating income and total shareholder
return targets, the achievement of which may increase or
decrease the number of shares which the grantee receives
upon vesting. The unearned restricted stock and performance
share compensation is being amortized to expense over
the applicable vesting periods. For 2012, 2011 and 2010,
total restricted stock and performance share compensation
expense was $14.3, $21.3 and $16.1, respectively.