LabCorp 2012 Annual Report Download - page 31
Download and view the complete annual report
Please find page 31 of the 2012 LabCorp annual report below. You can navigate through the pages in the report by either clicking on the pages listed below, or by using the keyword search tool below to find specific information within the annual report.-
 1
1 -
2
-
3
-
4
-
5
-
6
-
7
-
8
-
9
-
10
-
11
-
12
-
13
-
14
-
15
-
16
-
17
-
18
-
19
-
20
-
 21
21 -
 22
22 -
 23
23 -
 24
24 -
 25
25 -
 26
26 -
 27
27 -
 28
28 -
 29
29 -
 30
30 -
 31
31 -
 32
32 -
 33
33 -
 34
34 -
 35
35 -
 36
36 -
 37
37 -
 38
38 -
 39
39 -
 40
40 -
 41
41 -
42
-
43
-
44
-
45
-
46
-
47
-
48
-
49
-
50
-
51
-
52
-
53
-
54
 |
 |

29
LABORATORY CORPORATION OF AMERICA
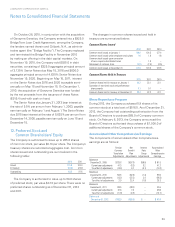
Notes to Consolidated Financial Statements
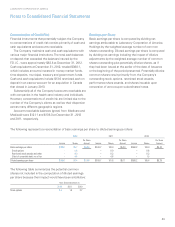
Concentration of Credit Risk
Financial instruments that potentially subject the Company
to concentrations of credit risk consist primarily of cash and
cash equivalents and accounts receivable.
The Company maintains cash and cash equivalents with
various major financial institutions. The total cash balances
on deposit that exceeded the balances insured by the
F.D.I.C., were approximately $82.8 at December 31, 2012.
Cash equivalents at December 31, 2012, totaled $388.1,
which includes amounts invested in money market funds,
time deposits, municipal, treasury and government funds.
Cash and cash equivalents include $13.6 restricted cash on
deposit in an escrow account for an acquisition in Canada
that closed in January 2013.
Substantially all of the Company’s accounts receivable are
with companies in the health care industry and individuals.
However, concentrations of credit risk are limited due to the
number of the Company’s clients as well as their dispersion
across many different geographic regions.
Accounts receivable balances (gross) from Medicare and
Medicaid were $121.1 and $138.3 at December 31, 2012
and 2011, respectively.
Earnings per Share
Basic earnings per share is computed by dividing net
earnings attributable to Laboratory Corporation of America
Holdings by the weighted average number of common
shares outstanding. Diluted earnings per share is computed
by dividing net earnings including the impact of dilutive
adjustments by the weighted average number of common
shares outstanding plus potentially dilutive shares, as if
they had been issued at the earlier of the date of issuance
or the beginning of the period presented. Potentially dilutive
common shares result primarily from the Company’s
outstanding stock options, restricted stock awards,
performance share awards, and shares issuable upon
conversion of zero-coupon subordinated notes.
The following represents a reconciliation of basic earnings per share to diluted earnings per share:
2012 2011 2010
Per Share Per Share Per Share
Income Shares Amount Income Shares Amount Income Shares Amount
Basic earnings per share $ 583.1 95.7 $ 6.09 $ 519.7 100.0 $ 5.20 $ 558.2 103.0 $ 5.42
Stock options – 0.8 – 0.9 – 0.6
Restricted stock awards and other – 0.3 – 0.3 – 0.3
Effect of convertible debt, net of tax – 0.6 – 0.6 – 1.5
Diluted earnings per share $ 583.1 97.4 $ 5.99 $ 519.7 101.8 $ 5.11 $ 558.2 105.4 $ 5.29
The following table summarizes the potential common
shares not included in the computation of diluted earnings
per share because their impact would have been antidilutive:
Years Ended December 31,
2012 2011 2010
Stock options 2.4 1.3 2.7