LabCorp 2012 Annual Report Download - page 2
Download and view the complete annual report
Please find page 2 of the 2012 LabCorp annual report below. You can navigate through the pages in the report by either clicking on the pages listed below, or by using the keyword search tool below to find specific information within the annual report.-
 1
1 -
 2
2 -
 3
3 -
 4
4 -
 5
5 -
 6
6 -
 7
7 -
 8
8 -
 9
9 -
 10
10 -
 11
11 -
 12
12 -
 13
13 -
14
-
15
-
16
-
17
-
18
-
19
-
20
-
21
-
22
-
23
-
24
-
25
-
26
-
27
-
28
-
29
-
30
-
31
-
32
-
33
-
34
-
35
-
36
-
37
-
38
-
39
-
40
-
41
-
42
-
43
-
44
-
45
-
46
-
47
-
48
-
49
-
50
-
51
-
52
-
53
-
54
 |
 |

About LabCorp®
Laboratory Corporation of America® Holdings, an S&P 500 company, is a pioneer in commercializing new
diagnostic technologies and the fi rst in its industry to embrace genomic testing. With annual revenues of
$5.7 billion in 2012, over 34,000 employees worldwide, and more than 220,000 clients, LabCorp offers more
than 4,000 tests ranging from routine blood analyses to reproductive genetics to companion diagnostics.
LabCorp furthers its scientifi c expertise and innovative clinical testing technology through its Specialty
Testing Group: The Center for Molecular Biology and Pathology, National Genetics Institute, ViroMed
Laboratories, Inc., The Center for Esoteric Testing, Litholink Corporation, Integrated Genetics, Integrated
Oncology, DIANON Systems, Inc., Monogram Biosciences, Inc., Colorado Coagulation, Cellmark Forensics,
MEDTOX, and Endocrine Sciences. LabCorp conducts clinical trials testing through its LabCorp Clinical
Trials division. LabCorp clients include physicians, government agencies, managed care organizations,
hospitals, clinical labs, and pharmaceutical companies. To learn more about our company, visit our Web site
at: www.labcorp.com.
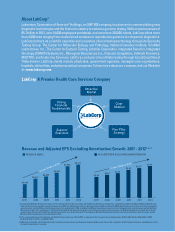
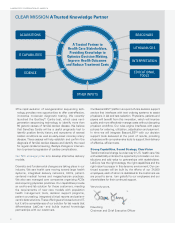
LabCorp A Premier Health Care Services Company
Revenue and Adjusted EPS Excluding Amortization Growth: 2007 – 20121, 2, 3
Strong
Financial
Fundamentals
Attractive
Market
Clear
Mission
Superior
Execution
Five-Pillar
Strategy
2007 2008 2009 2010 2011 2012
REVENUE ($MIL)
$4.068
$4.513
$4.695
$5.004
$5.542 $5.671
2007 2008 2009 2010 2011 2012
ADJUSTED EPS EXCLUDING AMORITIZATION
$4.45
$4.91 $5.24
$5.98 $6.37
$6.82
5-year CAGR of 6.9%
5-year CAGR of 8.9%
1. Excluding the $0.25 per diluted share impact of restructuring and other special charges and the $0.27 per diluted share impact from amortization in 2007; excluding the $0.44 per diluted share
impact of restructuring and other special charges and the $0.31 per diluted share impact from amortization in 2008; excluding the $(0.09) per diluted share impact of restructuring and other
special charges and the $0.35 per diluted share impact from amortization in 2009; excluding the $0.26 per diluted share impact of restructuring and other special charges and the $0.43 per
diluted share impact from amortization in 2010; excluding the $0.72 per diluted share impact of restructuring and other special charges, the $0.03 per diluted share impact from a loss on
the divestiture of assets and the $0.51 per diluted share impact from amortization in 2011; excluding the $0.29 per diluted share impact of restructuring and other special charges and the
$0.54 per diluted share impact from amortization in 2012.
2. EPS, as presented represents adjusted, non-GAAP fi nancial measures. Diluted EPS, as reported in the Company’s Annual Report were: $3.93 in 2007; $4.16 in 2008; $4.98 in 2009;
$5.29 in 2010; $5.11 in 2011; and $5.99 in 2012.
3. 2008 revenue includes a $7.5 million adjustment relating to certain historic overpayments made by Medicare for claims from a subsidiary of the Company that were submitted prior to the
Company’s acquisition of the entity.