LabCorp 2012 Annual Report Download - page 50
Download and view the complete annual report
Please find page 50 of the 2012 LabCorp annual report below. You can navigate through the pages in the report by either clicking on the pages listed below, or by using the keyword search tool below to find specific information within the annual report.-
 1
1 -
2
-
3
-
4
-
5
-
6
-
7
-
8
-
9
-
10
-
11
-
12
-
13
-
14
-
15
-
16
-
17
-
18
-
19
-
20
-
21
-
22
-
23
-
24
-
25
-
26
-
27
-
28
-
29
-
30
-
31
-
32
-
33
-
34
-
35
-
36
-
37
-
38
-
39
-
 40
40 -
 41
41 -
 42
42 -
 43
43 -
 44
44 -
 45
45 -
 46
46 -
 47
47 -
 48
48 -
 49
49 -
 50
50 -
 51
51 -
 52
52 -
 53
53 -
 54
54
 |
 |

48
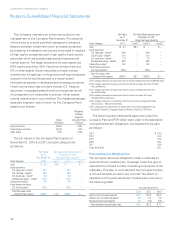
The Company maintains an investment policy for the
management of the Company Plan’s assets. The objective
of this policy is to build a portfolio designed to achieve a
balance between investment return and asset protection
by investing in indexed funds that are comprised of equities
of high quality companies and in high quality fixed income
securities which are broadly balanced and represent all
market sectors. The target allocations for plan assets are
50% equity securities, 45% fixed income securities and
5% in other assets. Equity securities primarily include
investments in large-cap, mid-cap and small-cap companies
located in the United States and to a lesser extent
international equities in developed and emerging countries.
Fixed income securities primarily include U.S. Treasury
securities, mortgage-backed bonds and corporate bonds
of companies from diversified industries. Other assets
include investments in commodities. The weighted-average
expected long-term rate of return for the Company Plan’s
assets is as follows:
Weighted-
Average
Expected
Target Long-Term Rate
Allocation of Return
Equity securities 50.0% 5.5%
Fixed income securities 45.0% 1.2%
Other assets 5.0% 0.3%
The fair values of the Company Plan’s assets at
December 31, 2012 and 2011, by asset category are
as follows:
Fair Value Fair Value Measurements as of
as of December 31, 2012
December 31, Using Fair Value Hierarchy
Asset Category 2012 Level 1 Level 2 Level 3
Cash $ 6.9 $ 6.9 $ – $ –
Equity securities:
U.S. large cap – blend(a)
58.1 – 58.1 –
U.S. mid cap – blend(b) 23.2 – 23.2 –
U.S. small cap – blend(c) 6.8 – 6.8 –
International equity – blend(d) 39.4 – 39.4 –
Commodities index(e) 11.5 – 11.5 –
Fixed income securities:
U.S. fixed income(f)
110.9 – 110.9 –
Total fair value of the
Company Plan’s assets $ 256.8 $ 6.9 $ 249.9 $ –
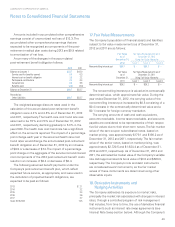
Fair Value Fair Value Measurements as of
as of December 31, 2011
December 31, Using Fair Value Hierarchy
Asset Category 2011 Level 1 Level 2 Level 3
Cash $ 3.7 $ 3.7 $ – $ –
Equity securities:
U.S. large cap – blend(a) 58.6 – 58.6 –
U.S. mid cap – blend(b) 21.9 – 21.9 –
U.S. small cap – blend(c) 7.2 – 7.2 –
International equity – blend(d) 33.0 – 33.0 –
Commodities index(e) 10.2 – 10.2 –
Fixed income securities:
U.S. fixed income(f) 109.9 – 109.9 –
Total fair value of the
Company Plan’s assets $ 244.5 $ 3.7 $ 240.8 $ –
(a) This category represents an equity index fund not actively managed that tracks the S&P 500 Index.
(b) This category represents an equity index fund not actively managed that tracks the S&P
mid-cap 400 Index.
(c) This category represents an equity index fund not actively managed that tracks the
Russell 2000 Index.
(d) This category represents an equity index fund not actively managed that tracks
the MSCI ACWI ex USA Index.
(e) This category represents a commodities index fund not actively managed that tracks
the Dow Jones – UBS Commodity Index.
(f) This category primarily represents bond index funds not actively managed that track
the Barclays Capital U.S. Aggregate Index and Barclays Capital U.S. TIPS Index.
The following assumed benefit payments under the
Company Plan and PEP, which were used in the calculation
of projected benefit obligations, are expected to be paid
as follows:
2013 $ 24.0
2014 23.2
2015 23.3
2016 23.5
2017 23.4
Years 2018-2022 119.1
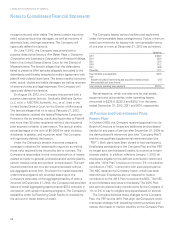
Post-retirement Medical Plan
The Company assumed obligations under a subsidiary’s
post-retirement medical plan. Coverage under this plan is
restricted to a limited number of existing employees of the
subsidiary. This plan is unfunded and the Company’s policy
is to fund benefits as claims are incurred. The effect on
operations of the post-retirement medical plan is shown in
the following table:
Year ended December 31,
2012 2011 2010
Service cost for benefits earned $ 0.4 $ 0.3 $ 0.3
Interest cost on benefit obligation 2.3 2.2 2.3
Net amortization and deferral 0.3 (0.2) (0.9)
Post-retirement medical plan costs $ 3.0 $ 2.3 $ 1.7
LABORATORY CORPORATION OF AMERICA
Notes to Consolidated Financial Statements