Lowe's 2005 Annual Report Download - page 2
Download and view the complete annual report
Please find page 2 of the 2005 Lowe's annual report below. You can navigate through the pages in the report by either clicking on the pages listed below, or by using the keyword search tool below to find specific information within the annual report.-
 1
1 -
 2
2 -
 3
3 -
 4
4 -
 5
5 -
 6
6 -
 7
7 -
 8
8 -
 9
9 -
 10
10 -
 11
11 -
 12
12 -
 13
13 -
14
-
15
-
16
-
17
-
18
-
19
-
20
-
21
-
22
-
23
-
24
-
25
-
26
-
27
-
28
-
29
-
30
-
31
-
32
-
33
-
34
-
35
-
36
-
37
-
38
-
39
-
40
-
41
-
42
-
43
-
44
-
45
-
46
-
47
-
48
-
49
-
50
-
51
-
52
 |
 |

Sales Growth
IN BILLIONS OF DOLLARS
94 95 96 97 98 99 00 01 02 03 04 05
45
36
27
18
9
0
Net Earnings Growth
IN MILLIONS OF DOLLARS
3,000
2,500
2,000
1,500
1,000
500
0
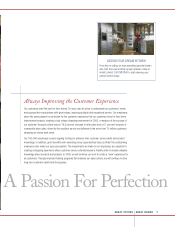
By improving the shopping
experience for our customers,
we have grown sales from
$6.4 billion in fi scal 1994 to
$43.2 billion in fi scal 2005.
That represents an 11-year
compound annual growth
rate of 19%.
Our net earnings are growing
faster than sales as we work
to become more efficient
in our operations. Growing
from $216 million in fiscal
1994 to almost $2.8 billion
in fiscal 2005, our 11-year
compound annual growth
rate is 26%.
94 95 96 97 98 99 00 01 02 03 04 05
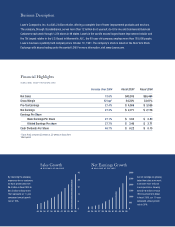
Business Description
Lowe’s Companies, Inc. is a $43.2 billion retailer, offering a complete line of home improvement products and services.
The company, through its subsidiaries, serves more than 12 million do-it-yourself, do-it-for-me and Commercial Business
Customers each week through 1,234 stores in 49 states. Lowe’s is the world’s second-largest home improvement retailer and
the 7th largest retailer in the U.S. Based in Mooresville, N.C., the 60-year-old company employs more than 185,000 people.
Lowe’s has been a publicly held company since October 10, 1961. The company’s stock is listed on the New York Stock
Exchange with shares trading under the symbol LOW. For more information, visit www.Lowes.com.
Financial Highlights
IN MILLIONS, EXCEPT PER SHARE DATA
Increase Over 2004 Fiscal 2005 1 Fiscal 2004
Net Sales 18.6% $43,243 $36,464
Gross Margin 62 bps2 34.23% 33.61%
Pre-Tax Earnings 27.4% $ 4,506 $ 3,536
Net Earnings 27.3% $ 2,771 $ 2,176
Earnings Per Share
Basic Earnings Per Share 27.1% $ 3.56 $ 2.80
Diluted Earnings Per share 27.7% $ 3.46 $ 2.71
Cash Dividends Per Share 46.7% $ 0.22 $ 0.15
1Fiscal 2005 contained 53 weeks vs. 52 weeks in fi scal 2004
2Basis points