Lowe's 2005 Annual Report Download - page 48
Download and view the complete annual report
Please find page 48 of the 2005 Lowe's annual report below. You can navigate through the pages in the report by either clicking on the pages listed below, or by using the keyword search tool below to find specific information within the annual report.-
 1
1 -
2
-
3
-
4
-
5
-
6
-
7
-
8
-
9
-
10
-
11
-
12
-
13
-
14
-
15
-
16
-
17
-
18
-
19
-
20
-
21
-
22
-
23
-
24
-
25
-
26
-
27
-
28
-
29
-
30
-
31
-
32
-
33
-
34
-
35
-
36
-
37
-
 38
38 -
 39
39 -
 40
40 -
 41
41 -
 42
42 -
 43
43 -
 44
44 -
 45
45 -
 46
46 -
 47
47 -
 48
48 -
 49
49 -
 50
50 -
 51
51 -
 52
52
 |
 |

46
|
L O W E ’ S 2 0 0 5 A N N U A L R E P O RT
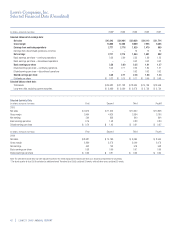
5-year February3, January28, January30, January31, February1, February2, January28, January29, January30, January31,
FiscalYearsEndedOn CGR% 2006* 2005 2004 2003 2002 2001* 2000 1999 1998 1997
Storesandpeople1
1 Numberofstores 14.6 1,234 1,087 952 828 718 1 624 550 497 456 410 1
2 Squarefootage(inmillions) 15.6 140.1 123.7 108.8 94.7 80.7 2 67.8 57.0 47.8 39.9 33.7 2
3 Numberofemployees 14.6 185,314 161,964 147,052 120,692 107,404 3 93,669 85,145 71,792 63,261 57,859 3
4 Customertransactions(inmillions) 14.0 639 575 521 460 394 4 342 299 268 230 195 4
5 Averagepurchase $ 67.67 $ 63.43 $ 59.21 $ 56.80 $ 55.05 5 $ 53.78 $ 51.73 $ 48.37 $ 46.77 $ 46.38 5
Comparativeincomestatements(inmillions)1
6 Sales 18.7 $ 43,243 $ 36,464 $ 30,838 $ 26,112 $ 21,714 6 $ 18,368 $ 15,445 $ 12,946 $ 10,779 $ 9,057 6
7 Depreciation 19.4 980 859 739 617 509 7 403 330 283 251 205 7
8 Interest 5.5 158 176 180 182 174 8 121 85 81 71 55 8
9 Pre-taxearnings 29.5 4,506 3,536 2,944 2,372 1,535 9 1,238 1,021 751 569 462 9
10 Incometaxprovision NM 1,735 1,360 1,115 893 566 10 454 373 273 205 162 10
11
Earningsfromcontinuingoperations 28.7 2,771 2,176 1,829 1,479 969 11 784 648 478 364 300
11
12 Earningsfromdiscontinuedoperations,netoftax NM – – 15 12 13 12 14 15 13 11 10 12
13 Netearnings 28.3 2,771 2,176 1,844 1,491 982 13 798 663 491 375 310 13
14 Cashdividends 26.4 171 116 87 66 60 14 53 48 41 38 35 14
15 Earningsretained 28.4 $ 2,600 $ 2,060 $ 1,757 $ 1,425 $ 922 15 $ 745 $ 615 $ 450 $ 337 $ 275 15
Dollarspershare(weightedaverageshares,assumingdilution)1
16 Sales 17.7 $ 53.85 $ 45.13 $ 37.79 $ 32.24 $ 26.97 16 $ 23.89 $ 20.11 $ 17.22 $ 14.55 $ 12.41 16
17 Earnings 27.2 3.46 2.71 2.28 1.86 1.23 17 1.04 0.86 0.65 0.51 0.42 17
18 Cashdividends 26.5 0.22 0.15 0.11 0.08 0.07 18 0.07 0.06 0.05 0.05 0.05 18
19 Earningsretained 27.3 3.24 2.55 2.15 1.76 1.15 19 0.97 0.80 0.60 0.45 0.38 19
20 Shareholders’equity 20.3 $ 17.86 $ 14.28 $ 12.52 $ 10.16 $ 8.18 20 $ 7.08 $ 6.07 $ 4.78 $ 4.00 $ 3.50 20
Financialratios
21 Assetturnover2 2.05 1.95 1.95 1.93 1.92 21 2.05 2.19 2.22 2.16 2.29 21
22 Returnonsales3 6.41% 5.97% 5.98% 5.71% 4.52% 22 4.34% 4.29% 3.79% 3.48% 3.42% 22
23 Returnonassets4 13.11% 11.64% 11.67% 11.01% 8.70% 23 8.91% 9.41% 8.42% 7.52% 7.83% 23
24 Returnonshareholders’equity5 24.02% 21.30% 22.40% 22.65% 18.03% 24 17.13% 18.45% 16.58% 14.66% 16.74% 24
Comparativebalancesheets(millions)6
25 Totalcurrentassets 13.5 $ 7,831 $ 6,903 $ 6,466 $ 5,362 $ 4,818 25 $ 4,158 $ 3,688 $ 2,865 $ 2,427 $ 2,135 25
26 Cashandshort-terminvestments 13.3 876 813 1,624 1,126 853 26 469 569 249 275 123 26
27 Accountsreceivable–net (35.3) 18 9 146 169 163 27 159 148 144 118 118 27
28 Merchandiseinventory–net 15.3 6,706 5,911 4,528 3,921 3,611 28 3,285 2,812 2,385 1,985 1,855 28
29 Othercurrentassets (8.7) 104 75 106 96 81 29 164 105 45 39 47 29
30 Fixedassets–net 18.6 16,354 13,911 11,819 10,245 8,565 30 6,964 5,122 4,046 3,294 2,756 30
31 Otherassets 9.1 203 178 241 160 141 31 131 111 108 79 57 31
32 Totalassets 16.9 24,682 21,138 18,695 15,796 13,546 32 11,287 8,952 7,047 5,835 4,984 32
33 Totalcurrentliabilities 14.9 5,832 5,648 4,144 3,360 2,940 33 2,911 2,380 1,924 1,554 1,443 33
34 Accountspayable 10.6 2,832 2,695 2,212 1,791 1,589 34 1,708 1,561 1,221 1,036 978 34
35 Othercurrentliabilities 27.8 2,544 1,937 1,520 1,204 971 35 745 401 270 241 213 35
36 Long-termdebt(excludingcurrentmaturities) 5.3 3,499 3,060 3,678 3,736 3,734 36 2,698 1,727 1,364 1,191 876 36
37 Totalliabilities 12.1 10,343 9,603 8,479 7,564 6,962 37 5,841 4,293 3,453 2,874 2,426 37
38
Shareholders’equity 21.4 $ 14,339 $ 11,535 $ 10,216 $ 8,232 $ 6,584 38 $ 5,446 $ 4,658 $ 3,594 $ 2,961 $ 2,558
38
39 Equity/long-termdebt(excludingcurrentmaturities) 4.10 3.77 2.78 2.20 1.76 39 2.02 2.70 2.63 2.49 2.92 39
40 Year-endleveragefactor:assets/equity 1.72 1.83 1.83 1.92 2.06 40 2.07 1.92 1.96 1.97 1.95 40
Shareholders,sharesandbookvalue
41 Shareholdersofrecord,year-end 27,427 27,071 26,553 25,405 19,277 41 16,895 15,446 14,508 12,386 12,530 41
42 Sharesoutstanding,year-end(inmillions) 784 774 787 782 776 42 766 765 749 738 731 42
43 Weightedaverageshares,assumingdilution(inmillions) 803 808 816 810 805 43 769 768 752 741 730 43
44 Bookvaluepershare $ 18.29 $ 14.90 $ 12.98 $ 10.53 $ 8.49 44 $ 7.11 $ 6.09 $ 4.80 $ 4.01 $ 3.50 44
Stockpriceduringcalendaryear7(adjustedforstocksplits)
45 High $ 69.70 $ 60.54 $ 60.42 $ 49.99 $ 48.88 45 $ 33.63 $ 33.22 $ 29.37 $ 12.89 $ 10.88 45
46 Low $ 50.72 $ 45.90 $ 33.37 $ 32.50 $ 24.79 46 $ 17.13 $ 21.50 $ 11.93 $ 8.09 $ 7.16 46
47 ClosingpriceDecember31 $ 66.66 $ 57.59 $ 55.39 $ 37.50 $ 46.41 47 $ 22.25 $ 29.88 $ 25.59 $ 11.93 $ 8.91 47
Price/earningsratio
48 High 20 22 27 27 40 48 32 39 45 25 26 48
49 Low 15 17 15 17 20 49 16 25 18 16 17 49
Lowe’sCompanies,Inc.
FinancialHistory(Unaudited)
10-YEAR FI NAN CIAL IN FOR MAT ION