Lowe's 2005 Annual Report Download - page 44
Download and view the complete annual report
Please find page 44 of the 2005 Lowe's annual report below. You can navigate through the pages in the report by either clicking on the pages listed below, or by using the keyword search tool below to find specific information within the annual report.-
 1
1 -
2
-
3
-
4
-
5
-
6
-
7
-
8
-
9
-
10
-
11
-
12
-
13
-
14
-
15
-
16
-
17
-
18
-
19
-
20
-
21
-
22
-
23
-
24
-
25
-
26
-
27
-
28
-
29
-
30
-
31
-
32
-
33
-
 34
34 -
 35
35 -
 36
36 -
 37
37 -
 38
38 -
 39
39 -
 40
40 -
 41
41 -
 42
42 -
 43
43 -
 44
44 -
 45
45 -
 46
46 -
 47
47 -
 48
48 -
 49
49 -
 50
50 -
 51
51 -
 52
52
 |
 |

42
|
L O W E ’ S 2 0 0 5 A N N U A L R E P O RT
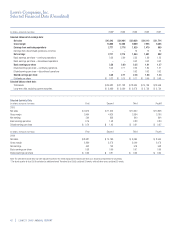
(Inmillions,exceptpersharedata) 2005* 2004 2003 2002 2001
Selectedstatementofearningsdata:
Netsales $
43,243 $
36,464 $
30,838 $
26,112 $
21,714
Grossmargin 14,800 12,256 9,569 7,925 6,265
Earningsfromcontinuingoperations 2,771 2,176 1,829 1,479 969
Earningsfromdiscontinuedoperations,netoftax – – 15 12 13
Netearnings 2,771 2,176 1,844 1,491 982
Basicearningspershare–continuingoperations 3.56 2.80 2.33 1.89 1.25
Basicearningspershare–discontinuedoperations – – 0.02 0.02 0.02
Basicearningspershare 3.56 2.80 2.35 1.91 1.27
Dilutedearningspershare–continuingoperations 3.46 2.71 2.26 1.84 1.21
Dilutedearningspershare–discontinuedoperations – – 0.02 0.02 0.02
Dilutedearningspershare 3.46 2.71 2.28 1.86 1.23
Dividendspershare $ 0.22 $ 0.15 $ 0.11 $ 0.09 $ 0.08
Selectedbalancesheetdata:
Totalassets $24,682 $21,138 $18,695 $15,796 $13,546
Long-termdebt,excludingcurrentmaturities $ 3,499 $ 3,060 $ 3,678 $ 3,736 $ 3,734
SelectedQuarterlyData:
(Inmillions,exceptpersharedata) First Second Third Fourth*
2005
Netsales $9,913 $11,929 $10,592 $10,808
Grossmargin 3,404 4,026 3,584 3,786
Netearnings 590 838 649 694
Basicearningspershare 0.76 1.08 0.83 0.89
Dilutedearningspershare $ 0.74 $ 1.05 $ 0.81 $ 0.87
(Inmillions,exceptpersharedata) First Second Third Fourth
2004
Netsales $
8,681 $
10,169 $
9,064 $
8,550
Grossmargin 2,860 3,378 3,040 2,978
Netearnings 452 700 516 508
Basicearningspershare 0.58 0.90 0.67 0.66
Dilutedearningspershare $
0.56 $
0.87 $
0.65 $
0.64
Note:Theselectedfinancialdatahasbeenadjustedtopresentthe2003disposaloftheContractorYardsasadiscontinuedoperationforallperiods.
*Thefourthquarteroffiscal2005containedanadditionalweek.Thereforefiscal2005contained53weeks,whileallotheryearscontained52weeks.
Lowe’sCompanies,Inc.
SelectedFinancialData(Unaudited)