Lowe's 2013 Annual Report Download - page 23
Download and view the complete annual report
Please find page 23 of the 2013 Lowe's annual report below. You can navigate through the pages in the report by either clicking on the pages listed below, or by using the keyword search tool below to find specific information within the annual report.-
 1
1 -
2
-
3
-
4
-
5
-
6
-
7
-
8
-
9
-
10
-
11
-
12
-
 13
13 -
 14
14 -
 15
15 -
 16
16 -
 17
17 -
 18
18 -
 19
19 -
 20
20 -
 21
21 -
 22
22 -
 23
23 -
 24
24 -
 25
25 -
 26
26 -
 27
27 -
 28
28 -
 29
29 -
 30
30 -
 31
31 -
 32
32 -
 33
33 -
34
-
35
-
36
-
37
-
38
-
39
-
40
-
41
-
42
-
43
-
44
-
45
-
46
-
47
-
48
-
49
-
50
-
51
-
52
-
53
-
54
-
55
-
56
-
57
-
58
-
59
-
60
-
61
-
62
-
63
-
64
-
65
-
66
-
67
-
68
-
69
-
70
-
71
-
72
-
73
-
74
-
75
-
76
-
77
-
78
-
79
-
80
-
81
-
82
-
83
-
84
-
85
 |
 |
15
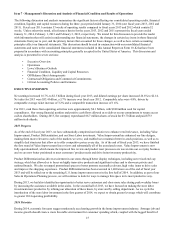
Item 7 - Management's Discussion and Analysis of Financial Condition and Results of Operations
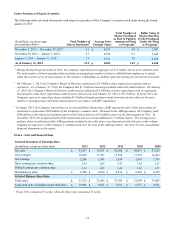
The following discussion and analysis summarizes the significant factors affecting our consolidated operating results, financial
condition, liquidity and capital resources during the three-year period ended January 31, 2014 (our fiscal years 2013, 2012 and
2011). Fiscal year 2011 contains 53 weeks of operating results compared to fiscal years 2013 and 2012 which contain 52
weeks. Unless otherwise noted, all references herein for the years 2013, 2012 and 2011 represent the fiscal years ended
January 31, 2014, February 1, 2013 and February 3, 2012, respectively. We intend for this discussion to provide the reader
with information that will assist in understanding our financial statements, the changes in certain key items in those financial
statements from year to year, and the primary factors that accounted for those changes, as well as how certain accounting
principles affect our financial statements. This discussion should be read in conjunction with our consolidated financial
statements and notes to the consolidated financial statements included in this Annual Report on Form 10-K that have been
prepared in accordance with accounting principles generally accepted in the United States of America. This discussion and
analysis is presented in seven sections:
• Executive Overview
• Operations
• Lowe’s Business Outlook
• Financial Condition, Liquidity and Capital Resources
• Off-Balance Sheet Arrangements
• Contractual Obligations and Commercial Commitments
• Critical Accounting Policies and Estimates
EXECUTIVE OVERVIEW
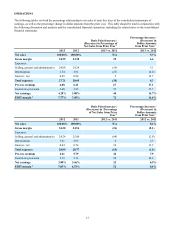
Net earnings increased 16.7% to $2.3 billion during fiscal year 2013, and diluted earnings per share increased 26.6% to $2.14.
Net sales for 2013 were $53.4 billion, a 5.7% increase over fiscal year 2012. Comparable sales were 4.8%, driven by
comparable average ticket increase of 3.2% and a comparable transaction increase of 1.6%.
For 2013, cash flows from operating activities were approximately $4.1 billion, with $940 million used for capital
expenditures. Our strong financial position and positive cash flows allowed us to deliver on our commitment to return excess
cash to shareholders. During 2013, the company repurchased 86.7 million shares of stock for $3.7 billion and paid $733
million in dividends.
2013 Progress
As of the end of fiscal year 2013, we have substantially completed our initiatives to enhance retail relevance, including Value
Improvement, Product Differentiation, and our Store Labor investment. Value Improvement has enhanced our line designs,
making them more relevant to each of the markets we serve, and enabled us to maintain better in-stock positions, as well as to
simplify deal structures that allow us to offer competitive prices every day. As of the end of fiscal year 2013, we have finished
the first round of Value Improvement line reviews and substantially all of the associated resets. Value Improvement is now
fully operationalized, which means the improved line review and product reset processes are woven into our everyday business,
and we are now better positioned to meet customers’ product needs and drive better inventory productivity.
Product Differentiation has driven excitement in our stores through better display techniques, including our revised end cap
strategy, which has allowed us to focus on highly innovative products and significant values and to showcase private and
national brands. We also revamped promotional spaces to better promote seasonally relevant, high value items to drive sales
and improve the shopping experience. Product Differentiation has been executed in 1,400 stores as of the end of fiscal year
2013 and will be rolled out to the remaining U.S. home improvement stores in the first half of 2014. In addition, as part of our
Sales & Operations Planning process, we will continue to look for ways to manage this space in its most productive way.
During 2013, we had also identified an opportunity to better serve customers and close more sales during peak weekday hours
by increasing the assistance available in the aisles. In the second half of 2013, we have focused on making the store labor
investment more productive by refining our allocation of these hours, by store and by selling department. As we cycle the
introduction of the store labor investment in the first quarter of 2014, we expect to obtain greater leverage which will contribute
to greater 2014 operating profitability.
2014 Priorities
During 2014, economic forecasts suggest moderately accelerating growth in the home improvement industry. Stronger job and
income growth should create a more favorable environment for consumer spending which, coupled with the lagged benefit of