Lowe's 2013 Annual Report Download - page 29
Download and view the complete annual report
Please find page 29 of the 2013 Lowe's annual report below. You can navigate through the pages in the report by either clicking on the pages listed below, or by using the keyword search tool below to find specific information within the annual report.-
 1
1 -
2
-
3
-
4
-
5
-
6
-
7
-
8
-
9
-
10
-
11
-
12
-
13
-
14
-
15
-
16
-
17
-
18
-
 19
19 -
 20
20 -
 21
21 -
 22
22 -
 23
23 -
 24
24 -
 25
25 -
 26
26 -
 27
27 -
 28
28 -
 29
29 -
 30
30 -
 31
31 -
 32
32 -
 33
33 -
 34
34 -
 35
35 -
 36
36 -
 37
37 -
 38
38 -
 39
39 -
40
-
41
-
42
-
43
-
44
-
45
-
46
-
47
-
48
-
49
-
50
-
51
-
52
-
53
-
54
-
55
-
56
-
57
-
58
-
59
-
60
-
61
-
62
-
63
-
64
-
65
-
66
-
67
-
68
-
69
-
70
-
71
-
72
-
73
-
74
-
75
-
76
-
77
-
78
-
79
-
80
-
81
-
82
-
83
-
84
-
85
 |
 |
21
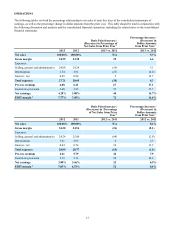
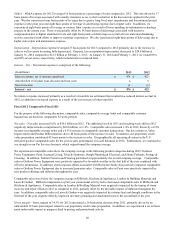
SG&A – The 84 basis point decrease in SG&A expense as a percentage of sales from 2011 to 2012 was primarily driven by 81
basis points of leverage due to long-lived asset impairment and other costs associated with the 27 store closures and
discontinued projects in 2011. We also experienced approximately 35 basis points of leverage associated with our proprietary
credit program, which was driven by increased portfolio income as a result of continued growth in the program. These were
partially offset by deleverage of approximately 15 basis points associated with incentive compensation, due to higher
attainment levels compared to targets for store-based employees relative to last year. In addition, we experienced nine basis
points of deleverage in contract labor associated with information technology projects to improve customer experiences.
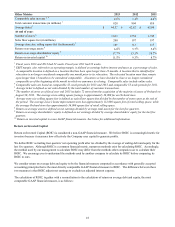
Depreciation – Depreciation expense deleveraged six basis points for 2012 compared to 2011 primarily due to higher
depreciation associated with IT capital investments made to improve customer experiences, which have shorter average useful
lives. Property, less accumulated depreciation, decreased to $21.5 billion at February 1, 2013 compared to $22.0 billion at
February 3, 2012. At February 1, 2013 and February 3, 2012 we owned 89% of our stores, which included stores on leased
land.
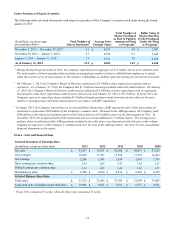
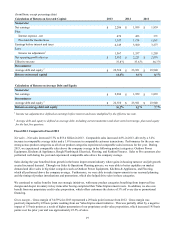
Interest – Net – Net interest expense is comprised of the following:
(In millions)
2012
2011
Interest expense, net of amount capitalized
$
427
$
379
Amortization of original issue discount and loan costs
5
4
Interest income
(9
)
(12
)
Interest - net
$
423
$
371
Net interest expense increased primarily as a result of the issuance of $1.0 billion and $2.0 billion of unsecured notes in
November 2011 and April 2012, respectively, partially offset by favorable tax settlements that resulted in a reduced interest
accrual during 2012.
Income tax provision – Our effective income tax rate was 37.6% in 2012 compared to 36.7% in 2011. The lower effective tax
rate in 2011 was the result of the recognition of one-time federal employee retention benefits from the federal HIRE (Hiring
Incentives to Restore Employment) retention tax credit, as well as the favorable settlement of certain state tax matters in the
third quarter of 2011.
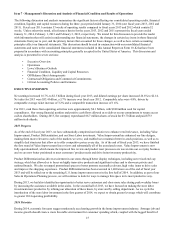
LOWE’S BUSINESS OUTLOOK
As of February 26, 2014, the date of our fourth quarter 2013 earnings release, we expected total sales in 2014 to increase
approximately 5% and comparable sales to increase approximately 4%. We expected to open approximately 15 home
improvement stores and five Orchard stores during 2014. In addition, earnings before interest and taxes as a percentage of
sales (operating margin) were expected to increase approximately 65 basis points, and the effective tax rate was expected to be
approximately 38.1%. Diluted earnings per share of $2.60 were expected for the fiscal year ending January 30, 2015. Our
guidance assumed approximately $3.4 billion in share repurchases during 2014, spread evenly across the four quarters.
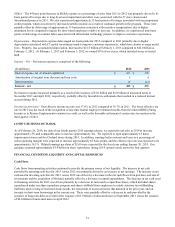
FINANCIAL CONDITION, LIQUIDITY AND CAPITAL RESOURCES
Cash Flows
Cash flows from operating activities continued to provide the primary source of our liquidity. The increase in net cash
provided by operating activities for 2013 versus 2012 was primarily driven by an increase in net earnings. The increase in net
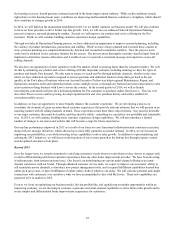
cash used in investing activities for 2013 versus 2012 was driven by a decrease in the net cash flows from purchase and sale of
investments and the acquisition of Orchard, partially offset by a decrease in capital expenditures. The decrease in net cash used
in financing activities for 2013 was driven primarily by a decrease in cash used to repurchase shares, which included shares
repurchased under our share repurchase program and shares withheld from employees to satisfy statutory tax withholding
liabilities upon vesting of restricted stock awards, the repayment of unsecured notes that matured in the prior year, and an
increase in short-term borrowings in the current year. These were partially offset by a decrease in cash provided by the
issuance of long term-debt as a result of the issuance of $1.0 billion of unsecured notes in September 2013 versus the issuance
of $2.0 billion of unsecured notes in April 2012.